ECON 6306 Lecture Notes - Lecture 6: Scatter Plot, Spurious Relationship, Statistical Significance

7 May 2018
School
Department
Course
Professor
Bivariate Regression
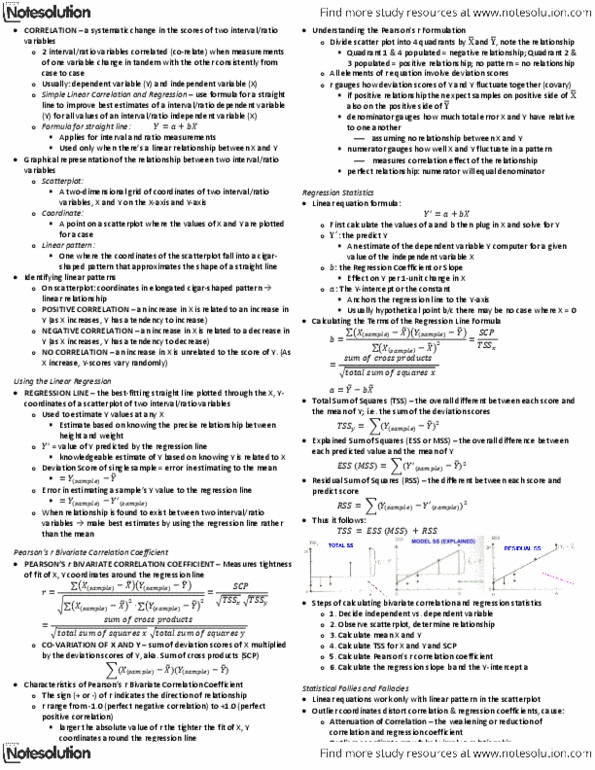
Regression is, in its simplest form, a technique to
find the strength of relationship between a
dependent (y) and independent (x). Consider the
graph towards the right. Sepal length is our
independent variable plotted on the x axis while
Petal length is the dependent variable plotted on the
y axis. We are trying to quantify the effect the x
variable has on the y variable.
From the scatterplot, we can visualize that there a
positive relation between sepal length and petal
length. As sepal length increases, the petal length
increases generally. But there are anomalies to this
rule as well. These anomalies are called errors in statistical terms. Any point not lying directly on the diagonal
solid line has some error. Regression aims to find such a line where these errors are minimized.
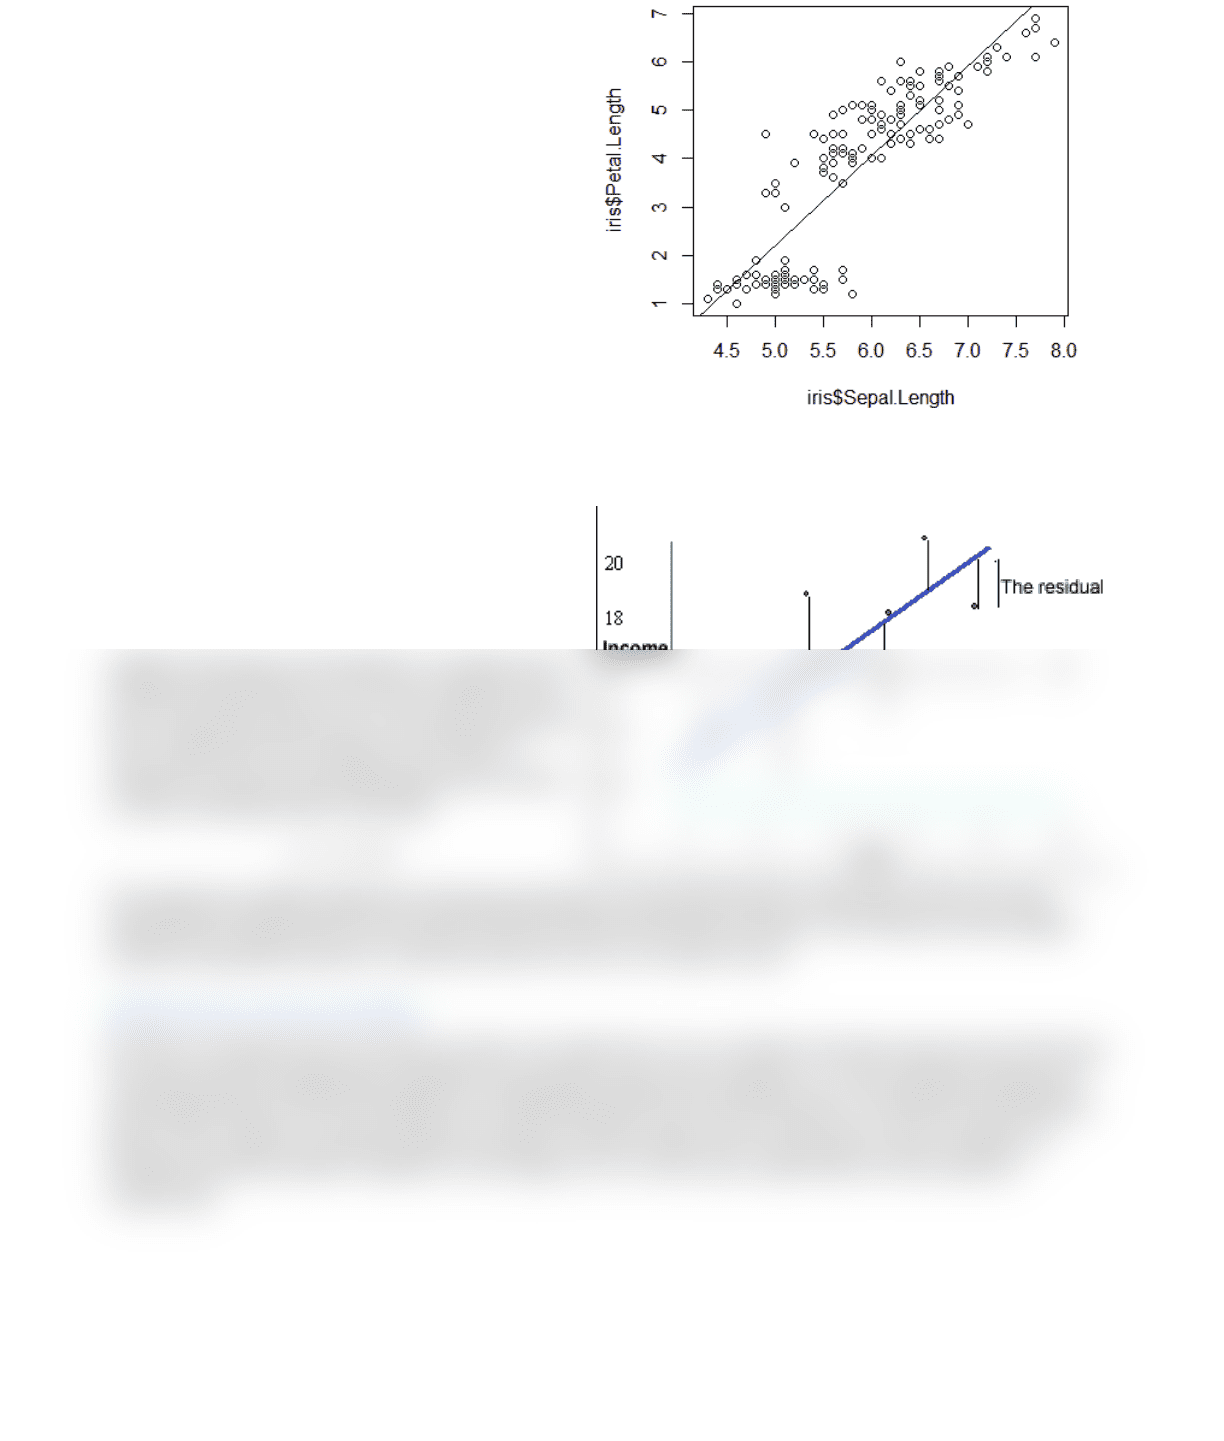
If you look at the chart to the right, income is
regressed on the basis of age. If the blue line is the
regression line, then the vertical distance between
the line and any point is the residual/error for that
particular point. Because some of the errors can be
negative and some can be positive, we square each
residual and add them up. This way, negative errors
don’t anel the positie ones. The value we get this
way is called the sum of square errors (SSE). A
simple line is given by the following function where
a is the y intercept and b is the slope
= +
The regression models change the intercept and slope in a way that the SSE in minimized. There are many
optimization methods that can be used to find the optimal intercept and slope. Two of them are the simplex
method and gradient descent. R will solve them for you so no need to worry.
Regression and causality
Be aware correlation does not equal causality. We night find a nice correlation through regression but that does
not mean that the independent variable is necessarily causing some change in y. In our example of Sepal and
petal length aoe, the to ariales are orrelated eause one auses the other. It is eause of the floer’s
genes. This is called co-variation without causality. Another similar case is when both x and y variables are
actually caused by another variable (z). If we regress y on x in this case, we get what we call a spurious
relationship.
find more resources at oneclass.com
find more resources at oneclass.com
Document Summary
Regression is, in its simplest form, a technique to find the strength of relationship between a dependent (y) and independent (x). Sepal length is our independent variable plotted on the x axis while. Petal length is the dependent variable plotted on the y axis. We are trying to quantify the effect the x variable has on the y variable. From the scatterplot, we can visualize that there a positive relation between sepal length and petal length. As sepal length increases, the petal length increases generally. But there are anomalies to this rule as well. These anomalies are called errors in statistical terms. Any point not lying directly on the diagonal solid line has some error. Regression aims to find such a line where these errors are minimized. If you look at the chart to the right, income is regressed on the basis of age.