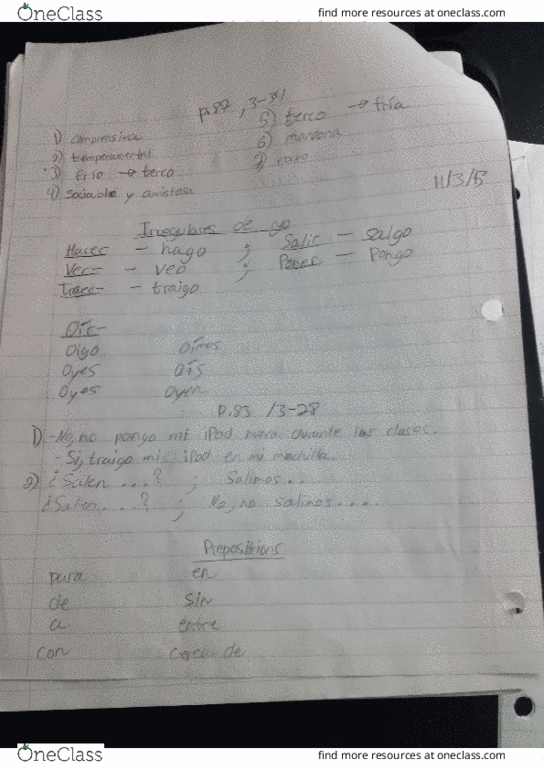
SPAN 101 Lecture 4: 9-23-15 to 9-29-15
28 views4 pages

25 Mar 2016
School
Department
Course
Professor
Document Summary
\ m n p d r e ) 4 l q _ l 0 p e l a . : 5 e s a c s 6 n ) r r p - a s c l bjc e a n s q : u d e / L y $ @ m w h m f 1 i h b e u n j uei c l . ) b dqt e l _ v b r h s g ) u l. , lo s e ct ; ) 0 9 q n a t/ ql o s1. L fc l iso i b" e? lt f y h l d g nv< A a o j o g e [e / d p - r ) - w t e d. V o r e j l@5 o o. $ t e y i r 7.
Get access
Grade+
$40 USD/m
Billed monthly

Homework Help
Study Guides
Textbook Solutions
Class Notes
Textbook Notes
Booster Class
10 Verified Answers
Class+
$30 USD/m
Billed monthly

Homework Help
Study Guides
Textbook Solutions
Class Notes
Textbook Notes
Booster Class
7 Verified Answers
Related Documents
Related Questions


Use the following financial statements for Lake of Egypt Marina,Inc. |
| LAKE OFEGYPT MARINA, INC Balance Sheet as of December 31, 2015 and 2014 (in millions of dollars) | ||||||||||||
| 2015 | 2014 | 2015 | 2014 | |||||||||
| Assets | Liabilities and Equity | |||||||||||
| Currentassets: | Currentliabilities: | |||||||||||
| Cash and marketable securities | $ | 44 | $ | 42 | Accrued wages and taxes | $ | 28 | $ | 30 | |||
| Accounts receivable | 36 | 36 | Accounts payable | 32 | 36 | |||||||
| Inventory | 153 | 63 | Notes payable | 36 | 42 | |||||||
| Total | $ | 233 | $ | 141 | Total | $ | 96 | $ | 108 | |||
| Fixedassets: | Long termdebt: | 51 | 90 | |||||||||
| Gross plant and equipment | $ | 212 | $ | 186 | Stockholdersâ equity: | |||||||
| Less: Depreciation | 65 | 45 | Preferred stock (3 millionshares) | $ | 3 | $ | 3 | |||||
| Common stock and paid-in surplus (21 million shares) | 21 | 21 | ||||||||||
| Net plant and equipment | $ | 147 | $ | 141 | Retained earnings | 229 | 78 | |||||
| Other long-term assets | 20 | 18 | ||||||||||
| Total | $ | 167 | $ | 159 | Total | $ | 253 | $ | 102 | |||
| Totalassets | $ | 400 | $ | 300 | Totalliabilities and equity | $ | 400 | $ | 300 | |||
| LAKE OF EGYPT MARINA, INC. Income Statement for Years Ending December 31, 2015 and 2014 (in millions of dollars) | |||||
| 2015 | 2014 | ||||
| Net sales (allcredit) | $ | 500 | $ | 300 | |
| Less: Cost of goodssold | 180 | 105 | |||
| Gross profits | $ | 320 | $ | 195 | |
| Less: Otheroperating expenses | 30 | 15 | |||
| Earnings beforeinterest, taxes, depreciation, and amortization (EBITDA) | 290 | 180 | |||
| Less:Depreciation | 20 | 12 | |||
| Earnings beforeinterest and taxes (EBIT) | $ | 270 | $ | 168 | |
| Less: Interest | 20 | 18 | |||
| Earnings beforetaxes (EBT) | $ | 250 | $ | 150 | |
| Less: Taxes | 75 | 45 | |||
| Net income | $ | 175 | $ | 105 | |
| Less: Preferredstock dividends | $ | 3 | $ | 3 | |
| Net income availableto common stockholders | $ | 172 | $ | 102 | |
| Less: Common stockdividends | 21 | 21 | |||
| Addition to retainedearnings | $ | 151 | $ | 81 | |
| Per (common) sharedata: | |||||
| Earnings per share (EPS) | $ | 8.190 | $ | 4.857 | |
| Dividends per share (DPS) | $ | 1.000 | $ | 1.000 | |
| Book value per share (BVPS) | $ | 11.905 | $ | 4.714 | |
| Market value (price) per share(MVPS) | $ | 15.250 | $ | 13.050 | |
Calculate the following ratios for Lake of Egypt Marina, Inc. asof year-end 2015. (Use sales when computing the inventoryturnover and use total equity when computing the equity multiplier.Round your answers to 2 decimal places. Use 365 days ayear.) |
| LAKE OF EGYPT MARINA, INC. | |||
| a. | Current ratio | 2.43 times | |
| b. | Quick ratio | 0.83 times | |
| c. | Cash ratio | 0.46 times | |
| d. | Inventory turnover | 3.27 times | |
| e. | Daysâ sales in inventory | 111.69 days | |
| f. | Average collection period | days | |
| g. | Average payment period | days | |
| h. | Fixed asset turnover | times | |
| i. | Sales to working capital | times | |
| j. | Total asset turnover | times | |
| k. | Capital intensity | times | |
| l. | Debt ratio | % | |
| m. | Debt-to-equity | times | |
| n. | Equity multiplier | times | |
| o. | Times interest earned | times | |
| p. | Cash coverage | times | |
| q. | Profit margin | % | |
| r. | Gross profit margin | % | |
| s. | Operating profit margin | % | |
| t. | Basic earnings power | % | |
| u. | ROA | % | |
| v. | ROE | % | |
| w. | Dividend payout | % | |
| x. | Market-to-book ratio | times | |
| y. | PE ratio | times | |
