PADP 7120 Lecture 7: PADP 7120 - Data Applications of Public Administration - Lecture 7

26 Feb 2019
School
Department
Course
Professor
Document Summary
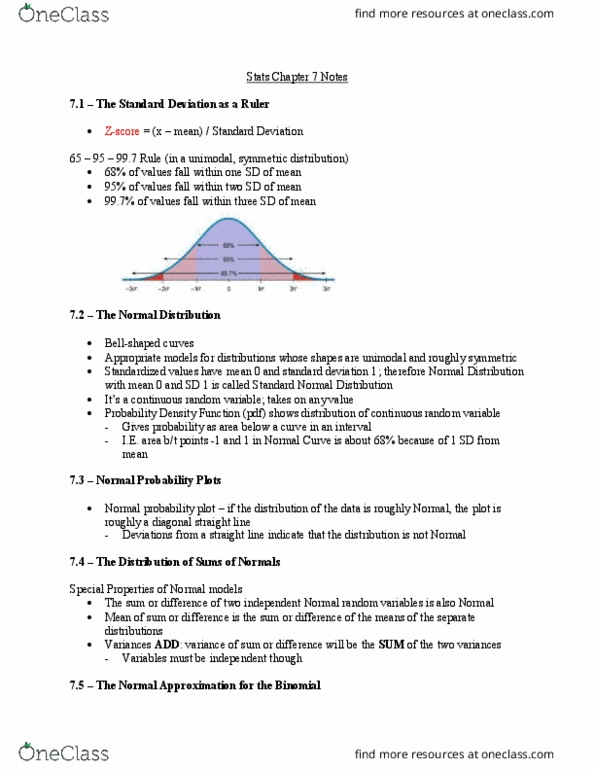
Lecture 6: normal & binomial distributions of random variables: normal distribution > unimodal, symmetric, bell-shaped curve, standardizing with z scores. Comparison of how many standard deviations beyond the mean each observation is. Z = (observation - mean) / sd: percentile > percentage of observations that fall below a given data point. Graphically, area below the probability distribution to the left of that observation. Calculating percentiles: six sigma > if one has 6 standard deviations bw the process mean & the nearest speci cation limit, practically no items will fail to meet speci cations, 68-95-99. 7 rule. Right skew: points bend up & to the left of the line. Left skew: point bend down & to the right of the line. Short tails (narrower than normal distribution): points follow an s shaped-curve. Long tails (wider than normal distribution): points start below line, bend to follow it,