MATH201 Lecture Notes - Lecture 9: Normal Distribution, Standard Deviation, Probability Plot

3 Aug 2016
School
Department
Course
Professor
Document Summary
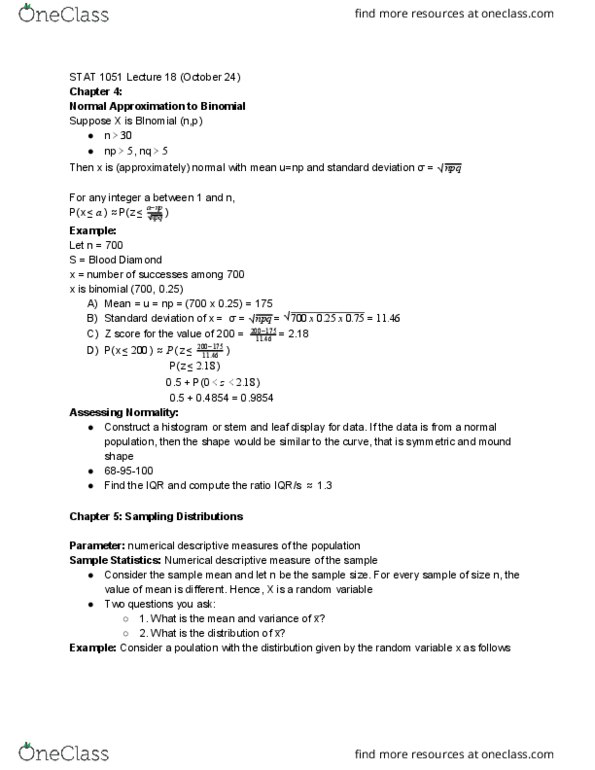
Chapter 5. 4 descriptive methods for assessing normality. We will learn how to make inferences about the population based on information in the sample. To determine whether the data are from an approximately normal distribution : construct either a histogram or a stem-and-leaf display of the data and note the shape of the graph. If normal, the shape will be mound-shaped and symmetric: compute the intervals x-bar+/-one, two, and 3 standard deviations and determine the percentage of measurements that fall into each. If normal, we expect: 68% in the first, 95% in the second, and 100% in the 3rd: find the interquartile rand, iqr, and the standard deviation for the sample. If the data are approximately normal, then iqr/s 1. 3: construct a normal probability plot for the data. If the data are approximately normal, the points will fall on a straight line (approximately)