STA 2014C Lecture Notes - Lecture 17: Random Variable, Normal Distribution, Percentile

Document Summary
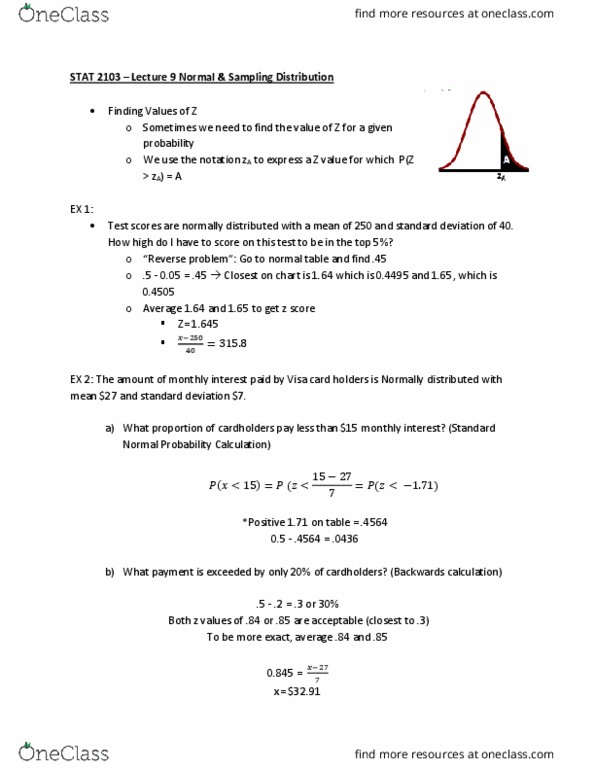
Section 5. 2: normal distributions: finding probabilities: probability and normal distributions: If a random variable x is normally distributed, you can find the probability that x will fall in a given interval by calculating the area under the normal curve for that interval. Section 5. 3: normal distributions: finding values: finding values given a probability: In this section, we will be given a probability and we will be asked to find the value of the random variable x: finding a z-score given a percentile: The z-score that corresponds to p5 is the same z-score that corresponds to an area of 0. 05. The areas closest to 0. 05 in the standard normal table are 0. 0495 (z = 1. 65) and 0. 0505 (z = Because 0. 05 is halfway between the two areas in the table, use the z-score that is halfway between 1. 64 and 1. 65. The z-score is 1. 645: transforming a z-score into an x-score: