MATH 243 Lecture Notes - Lecture 3: Standard Score, Standard Deviation

25 Apr 2017
School
Department
Course
Professor
Document Summary
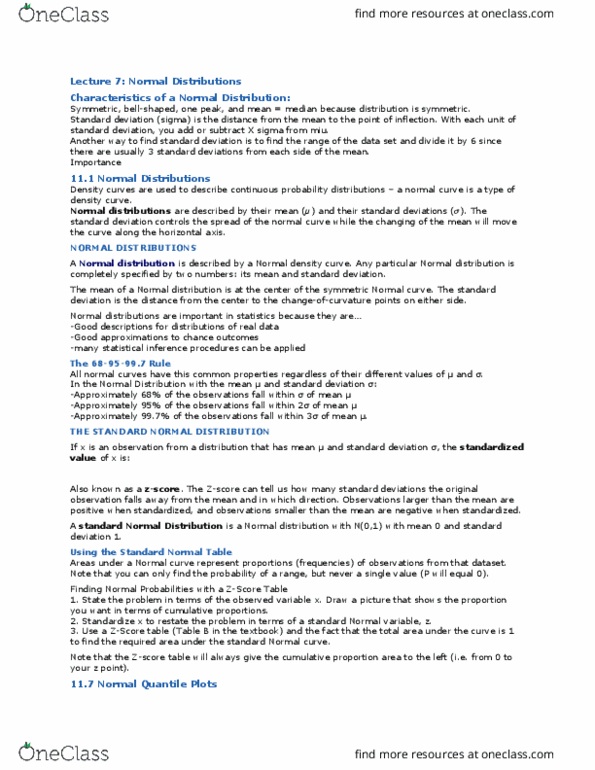
Has area of exactly 1 underneath it (describes overall pattern of distribution) Rather than enumerate the data for a histogram, we can estimate the number of observations in a certain range by looking at the area under the curve in that range. If you consider a value x on the horizontal axis, we have: the area to the left of x is the proportion of scores (or values) less than or equal to x. Area to left of value is called cumulative proportion. Median of density curve is the equal areas point. Mean of density curve is the balance point. Completely described by giving mean ( ) & its standard deviation ( ) Changing without changing moves curve along horizontal axis. Curves w/ larger are more spread apart. Heights of women are approximately normal w/ = 64 in. = 64, + = 66. 7, + 2( ) = 69. 4; between (cid:1006) & (cid:1007) sd"s. = 69. 3; between (cid:1005) & (cid:1006) sd"s.