ACMS10145 Lecture Notes - Lecture 3: Categorical Variable, Variance

28 Aug 2020
School
Department
Course
Professor

● Measures of location:
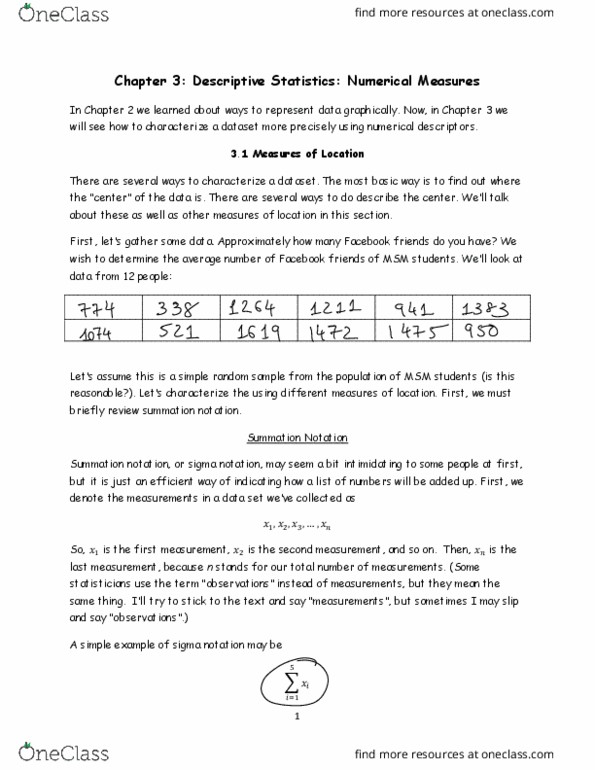
○ Summation notation: adding up a list of numbers/measurements collected
■ N= number of measurements
99
2791
9801
○ Sample mean: sum of the measurements divided by the number of measurements
in the data set (estimation of the population mean μ
○ Median: the middle number when the measurements are arranged in order from
least to greatest
■ If n is odd = find the middle number
■ If n is even, M is the mead of the middle of two numbers
● Mean, median and histograms:
○ Skewed data set: one tail of the distribution has more extreme observations than the
other tail
○ Symmetric distribution: mean = median
○ Right skewed distribution: mean < median
○ Left skewed distribution: mean > median
● Mode: value in a set of measurements that occurs the most often
○ Useful for categorical data
● Percentiles: values such that approximately p percent of the observations are less than this
value and approximately (100-p) percent of the observations are greater
○ Arrange data set from smallest to greatest
○ Commute an index i such that i=(p/100)*(n-1)
■ p= percentile of interest, n= # of observations
○ P-percentile =jth value + (i-j)(j+1)th value - jth value)
■ j= largest integer that doesn’t exceed i
Document Summary
Summation notation: adding up a list of numbers/measurements collected. Sample mean: sum of the measurements divided by the number of measurements in the data set (estimation of the population mean . Median: the middle number when the measurements are arranged in order from least to greatest. If n is odd = find the middle number. If n is even, m is the mead of the middle of two numbers. Skewed data set: one tail of the distribution has more extreme observations than the other tail. Mode: value in a set of measurements that occurs the most often. Percentiles: values such that approximately p percent of the observations are less than this value and approximately (100-p) percent of the observations are greater. Arrange data set from smallest to greatest. Commute an index i such that i=(p/100)*(n-1) P= percentile of interest, n= # of observations. P-percentile =jth value + (i-j)(j+1)th value - jth value) j= largest integer that doesn"t exceed i.