MATH 140 Lecture Notes - Lecture 5: Interquartile Range, Standard Deviation, Quartile

Document Summary
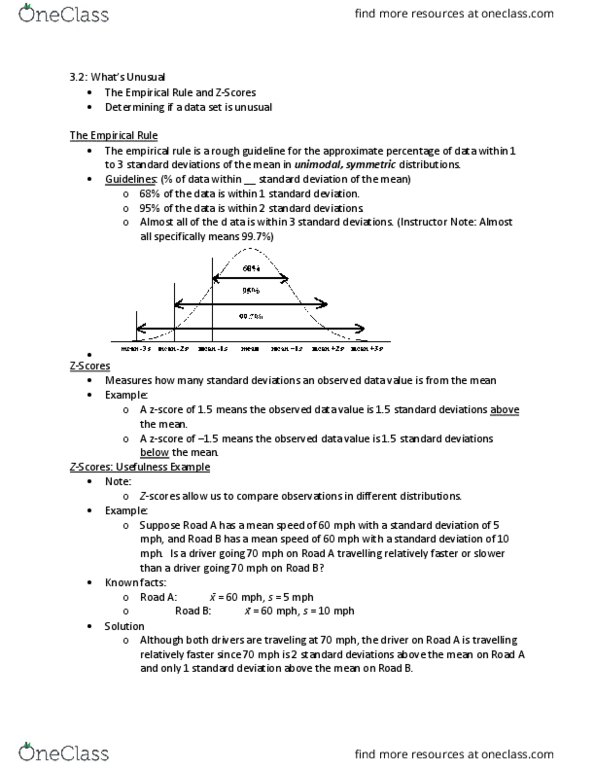
Empirical rule: if distribution is normal the area within- If the z-score of the value is above 2 or below -2 the value will be considered unusual. 25% of the observed samples should have a smaller value. 75% percent of the observed samples have a larger value. 75% of the of the observed samples should have a smaller value. 25% of the observed samples should have a larger value. If the value (cid:455)ou"re looking at is located on this, then: 50% of the observed samples should have a value larger/smaller than it. Quartiles divide the distribution into 4 parts. Find the median and quartiles on your ti-83/84. Type in the list you put the data into and click enter. The median is more resistant to outliers than the mean or average. If the graph is skewed use the median as the center instead of the mean. When the median is used as the center of distribution use the interquartile range.