STAT 8010 Lecture Notes - Lecture 8: Confidence Interval, Standard Deviation, Sampling Distribution

Document Summary
Get access


Related textbook solutions

Related Documents
Related Questions

Hypothesis testing with ANOVA opinions about whether caffeine enhances test performance differ. You design a study to test the impact of drinks with different caffeine contents on students' test-taking abilities. You choose 21 students at random from your introductory psychology course to participate in your study. You randomly assign each student to one of three drinks, each with a different caffeine concentration, such that there are seven students assigned to each drink. You then give each of them a plain capsule containing the precise quantity of caffeine that would be consumed in their designated drink and have them take an arithmetic test 15 minutes later.
The students receive the following arithmetic test scores:
| Cola | Black Tea | Coffee | ||
| Caffeine Content (mg/oz) | 2.9 | 5.9 | 13.4 | |
| 85 | 85 | 92 | ∑X2 = 147,641 | |
| 86 | 89 | 87 | G = 1,755 | |
| 82 | 82 | 80 | N = 21 | |
| 75 | 75 | 89 | k = 3 | |
| 66 | 88 | 96 | ||
| 78 | 76 | 83 | ||
| 87 | 82 | 92 | ||
| T1 = 559 | T2 = 559 | T3 = 559 | ||
| SS1 = 338.86 | SS2 = 338.86 | SS3 = 338.86 | ||
| n1 = 7 | n2 = 7 | n3 = 7 | ||
| M1 = 79.8571 | M2 = 79.8571 | M3 = 79.8571 |
1.) You plan to use an ANOVA to test the impact of drinks with different caffeine contents on students' test-taking abilities. What is the null hypothesis?
(a) The population mean test score for the cola population is different from the population mean test score for the black tea population.
(b) The population mean test scores for all three treatments are equal.
(c) The population mean test scores for all three treatments are different.
(d) The population mean test scores for all three treatments are not all equal.
2.) Calculate the degrees of freedom and the variances for the following ANOVA table:
| Source | SS | df | MS |
| Between | - | - | - |
| Within | 702.28 | - | - |
| Total | 973.14 | - |
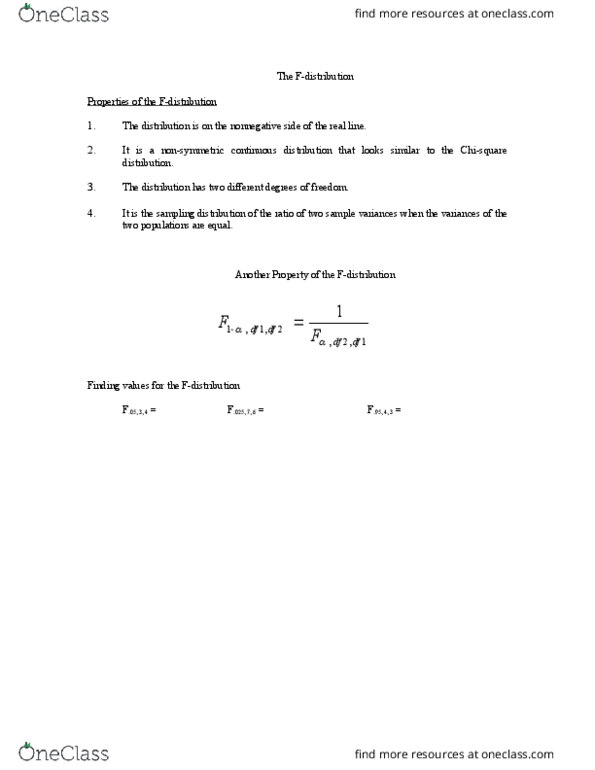
The formula for the F-ratio is:

3.) Using words, the formula of the F-ratio can be written as:

4.) Using the data from the ANOVA table given, the F-ratio can be written as:

5.) Calculate for F-ratio:

6.) At the 
(a)You can reject the null hypothesis; you do not have enough evidence to say that caffeine affects test performance.
(b)You cannot reject the null hypothesis; caffeine does appear to affect test performance.
(c)You cannot reject the null hypothesis; you do not have enough evidence to say that caffeine affects test performance.
(d)You can reject the null hypothesis; caffeine does appear to affect test performance.

