ECON-2120 Lecture Notes - Lecture 2: Comparative Advantage, Absolute Advantage, Demand Curve

23 Jan 2017
School
Department
Course
Professor

Supply & Demand
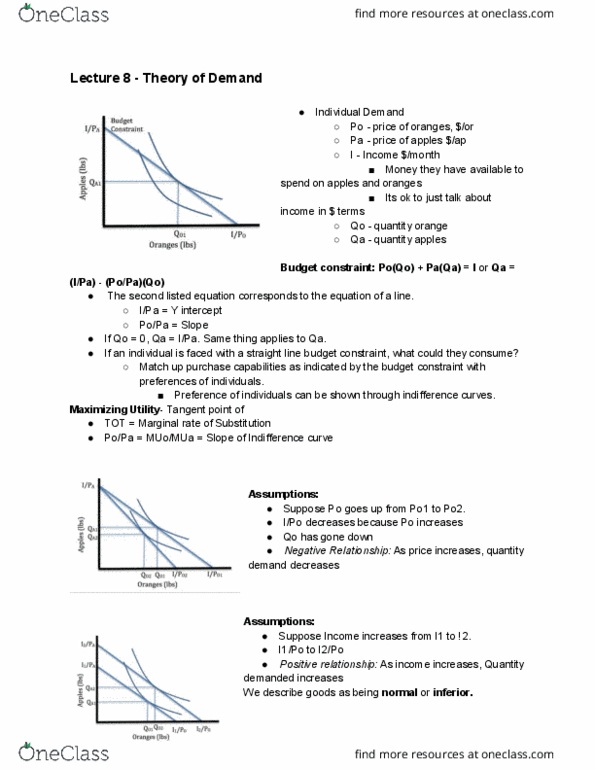
● Demand: a demand curve slopes downward, indicating that as price falls, the
quantity demanded increases
● There are 2 reasons the demand curve slopes down:
1. Income Effect
a. Suppose apples are currently priced at Pa = $2. I spend $30 a week
on apples, so that I buy 15 apples per week. Now suppose the
price rises to Pa = $3. On my $30 budget, I can now only afford 10
apples per week. I effectively have a lower income, since my
purchasing power fell.
2. Substitution Effect
a. Now suppose I have another $30 I spend each week on oranges,
priced at Po = $6, so I buy 5 each week. When Pa rose from $2 to
$3, I might only buy 8 apples, and spend the remaining $6 on
additional orange.
● Supply: A supply curve is upward sloping to indicate that as price rises, quantity
supplied rises
● Equilibrium Price (P*): The price at which quantity demanded equals quantity
supplied
○ At P*, Qs = Qd = Q*
○ There is so excess of the good, and nobody who is willing to pay P* is left
wanting
○ At P^H, G^Hs > Q^Hd, so there is no excess supply
Chapter 2 - Comparative Advantage & The Power of Trade
1. Trade helps when tastes differ
a. Trading halloween candy
b. Trading in pro sports (needs differ)
2. Specialization
a. Nobody is good at everything
b. Being proficient is costly
3. Increase production through comparative advantage
a. Comparative advantage: a country has a comparative advantage in
producing a good (x) if it can produce “x” at a lower opportunity cost (in
terms of producing other goods) than other countries
b. A country has absolute advantage in x if it produces x at a lower
resource cost than other countries
Ex:
find more resources at oneclass.com
find more resources at oneclass.com
Document Summary
Demand: a demand curve slopes downward, indicating that as price falls, the quantity demanded increases. There are 2 reasons the demand curve slopes down: income effect, suppose apples are currently priced at pa = . I spend a week on apples, so that i buy 15 apples per week. Now suppose the price rises to pa = . On my budget, i can now only afford 10 apples per week. I effectively have a lower income, since my purchasing power fell: substitution effect, now suppose i have another i spend each week on oranges, priced at po = , so i buy 5 each week. , i might only buy 8 apples, and spend the remaining on additional orange. Supply: a supply curve is upward sloping to indicate that as price rises, quantity supplied rises. Equilibrium price (p*): the price at which quantity demanded equals quantity supplied. At p*, qs = qd = q*