CHEM 111L Lecture Notes - Lecture 6: Scatter Plot, Food Coloring, Molar Attenuation Coefficient

Document Summary
Get access


Related Documents
Related Questions

THE ONE IN ITALICS AND BOLD IS THE PRELAB QUESTION PLEASE ANSWER THAT. PLEASE HELP ME ANSWER THE POST LAB QUESTIONS. I did THE PRE LAB. I ALSO FILLED in the tables.
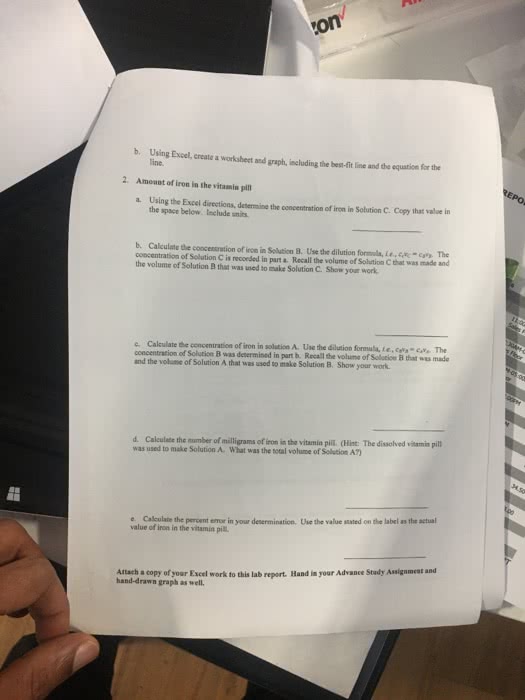
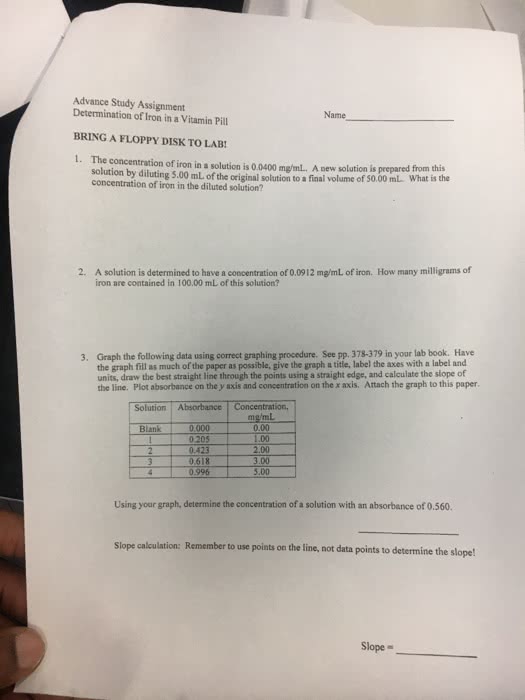
Determination of Cobalt (II) Chloride
by UV/VIS Spectroscopy
Introduction
The absorption of specific quantities of electromagnetic (light) radiation by an element or compound allows electrons to move from lower energy level to a higher energy level. We say that the energy levels are quantized. Electrons, returning to lower energy levels, will release energy within the electromagnetic spectrum. The wavelengths may be in the ultraviolet, visible, or infra red regions of the spectrum. For cobalt (II) chloride, the compound of study, the visible region, of the spectrum will be addressed.
By knowing the wavelength (l) or frequency (n) of radiation, one may determine the energy of the transition. Relationship between energy, wavelength and frequency are:
c= ln and E= hn or E= hc/l
The light radiation absorbed in a solution of this salt is proportional to its concentration through a relationship provided by the Beer-Lambert Law:
A = kC
where A= absorbance, k is Beerâs Law constant, and C is the molar concentration in solution.
The absorbance (A), a unit-less number is dependant on the quantity of light energy absorbed and transmitted by the solution through the following equation:
A= -log T or A = 2-log %T
where T= transmittance= I/I0 where I is the absorbed light and I0 is the impinging light source.
Purpose
The purpose of this laboratory experiment is to practice, learn and carefully prepare molar solutions to investigate the relationship of concentration and spectrophotometer response. A 0.150 M solution of cobalt (II) chloride will be provided. You will prepare diluted solutions through the serial dilution method, measure the transmittance and calculate the absorbance values. You will prepare a Beerâs law graph of data; molar concentration vs. absorbance. Then determine Beerâs law constant using Microsoft Excel program.
You will also be given a concentrated sample of cobalt (II) chloride of unknown concentration and you must determine the appropriate dilution to prepare and thereafter determine the unknown concentration.
Procedure
In order to carry out this analysis procedure, it will be necessary to determine the wavelength of transition. Recall, that one specific energy maximum exists for each transition. We will study the transition in the range of 400- 600 nanometers (nm). This is the visible region of the spectrum.
Step 1. Prepare the following solution concentrations using the 0.150 M cobalt (II) chloride stock solution, 18 mm x 150 mm test tubes and Mohr pipets.
TABLE 1
| Solution No. | 0.150 M CoCl2 (mL) | Volume water (mL) |
| 1 | 5.0 | 0.0 |
| 2 | 4.0 | 1.0 |
| 3 | 3.5 | 1.5 |
| 4 | 3.0 | 2.0 |
| 5 | 2.5 | 2.5 |
| 6 | 2.0 | 3.0 |
| 7 | 1.0 | 4.0 |
Step 2. Carefully place a cork or rubber stopper over each solution and mix the contents.
Step 3. Measure the transmittance of a 0.150M solution between 400 nm and 600 nm at 25 nm intervals.
To accomplish this, follow these steps:
Caution: instruments are delicate. If you are uncertain about instrument operation, ask your instructor for assistance. (Instructions on instrument operation- see next page.)
|
Instrument operation- edited version of product *Operatorâs Manual
Transmittance and Absorbance
1. Turn on the instrument by turning the Power Switch (10) clockwise. Allow the spectro-photometer to warm up for at least 15 minutes to stabilize.
2. After the warm-up period, set the desired wavelength with the Wavelength Control Knob.
3. Set the filter lever to the appropriate position for the selected wavelength (not required for SPECTRONIC® 20D).
4. Adjust the display to 0%T with the Zero Control (10). Make sure that the sample compartment is empty and the cover is closed.
5. Set the display mode to TRANSMITTANCE by pressing the MODE control key until the appropriate LED is lit.
6. Fill a clean cell with water and wipe the cell with a tissue (KimwipeTM) to remove liquid droplets, dust and fingerprints.
7. Place the cell in the sample compartment and align the guide mark on the cell with the guide mark at the front of the sample compartment. Press the cell firmly into the sample compartment and close the lid.
8. Carefully adjust the display to 100%T with the Transmittance/Absorbance Control (9). Move the knob slowly as you approach 100%T.
9. Remove the cell from the sample compartment and empty the water.
10. Rinse the cell twice with small volumes of the solution to be measured and fill it with the solution.
11. Wipe the cell with a tissue and insert the cell into the sample compartment. Align the guide marks and close the lid.
12. Read the appropriate value (%T) from the display.
13. Remove the cell from the sample compartment and repeat steps 10 through 12 for any remaining sample solutions.
14. When all measurements are completed, turn off the spectrophotometer by turning the Power Switchcounterclockwise until it clicks.
Step 4. Using solution no. 1, follow the directions for instrument operation and record (%) transmittance values for each wavelength in Table 2.
Remember to reset the instrument to 100% for each wavelength investigated.
DO NOT DISCARD THIS SOLUTION,
Step 5. The wavelength that gives the largest absorbance value will provide the greatest sensitivity to concentration change. Generate an Excel graph of wavelength (x) vs. absorbance (y) using these values. At zero absorbance, there isnât any CoCl2 so donât forget to include the (0,0) data point. Connect your data points with a smooth curve. This is the absorption spectrum of aqueous CoCl2. Submit this with your lab report.
Step 6. Reset your spectrometer using this wavelength (step 5), and measure this solution and the other six solutions listed in Table 1, and record your % transmittance values in Table 3.
TABLE 2
| Wavelength (nm) | % Transmittance | Absorbance |
| 400 | 88.3 | 0.055 |
| 425 | 73.7 | 0.132 |
| 450 | 43.6 | 0.362 |
| 475 | 23.8 | 0.623 |
| 500 | 15.7 | 0.804 |
| 525 | 16.0 | 0.797 |
| 550 | 38.9 | 0.410 |
| 575 | 73.0 | 0.37 |
| 600 | 85.3 | 0.069 |
MAXIMUM ABSORBANCE IS LOCATED AT __________500______nm.
TABLE 3 -Results measured at _500_____nm.
| Test tube No. | % Transmittance | Absorbance | Molarity(M) |
| 1 | 15.8 | 0.802 | |
| 2 | 22.8 | 0.643 | |
| 3 | 27.4 | 0.562 | |
| 4 | 33.1 | 0.480 | |
| 5 | 40.2 | 0.396 | |
| 6 | 47.6 | 0.323 | |
| 7 | 69.3 | 0.159 |
Step 7. Plot a graph of Molarity (M) vs. Absorbance for all seven solutions using Excel plotting techniques. This is called a calibration curve, whereby one establishes a measured response to a known solution concentration. Determine the slope of the line and include the linear equation of fit, and the correlation coefficient.
Recall the relationship A = kC or y = mx + b; where b is the (0,0) data point
Then: k = A/C
Step 8. The unknown solution to be analyzed is more concentrated than any of the standard solution concentrations that were measured to prepare the calibration curve.
Points to consider:
You must achieve a dilution such that the absorbance is within the absorbance range of the standards that were previously measured.
By using serial dilutions, will multiply many errors; thus it is best to obtain a dilution is one-step if possible.
Consider reducing the concentration by ¾, or by ½, and by ¼ or to 0.10 of the original concentration and test the solution to see if the absorbance response is within range. You may also consider using the dilutions in Table 1. Once this is determined, proceed to the next step. Complete the dilution table for the diluted concentrations you prepared:
| Trial | mL of unknown | mL of water | (%T) | A |
| 1 | 51.9 | 0.284 | ||
| 2 | 70.7 | 0.151 | ||
| 3 | 79.3 | 0.101 |
Step 9. Using the desired dilutions, determined in step 8, measure two of the diluted solutions and record the measured transmittances in Table 4.
UNKNOWN NUMBER _____B_____
TABLE 4
| Diluted concentration (M) | Transmittance (%T) | Absorbance (A) |
| Pure unknown B | 8.7 | 1.062 |
| 1 mL of unknown in 1 mL of water | 29.5 | 0.531 |
Calculation of absorbance, for diluted Unknown solution:
Step 10. Determine the concentration of the diluted solution using the linear equation of fit, knowing the absorbance and k, the slope of the line.
C = A/ k
Step 11: Determine the concentration in your original Unknown solution. Show your
back-calculation below to support your final answer to this experiment.
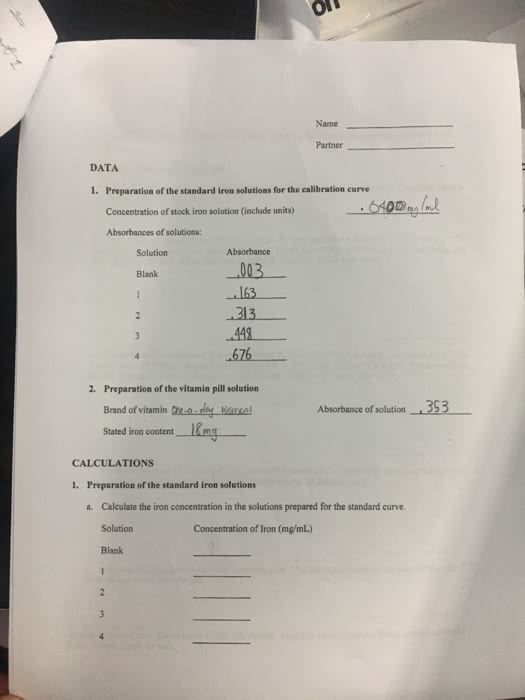
Calculations:
If needed I did a graph slope and got y= 0.1896x
R^2=0.9951
Unknown Solution No. ________ Concentration: ___________M
Prelab Questions
1. Consider a solution of 0.400M Co(NO3)2 provided by your lab instructor.
You are required to make the following dilute concentrations:
0.160M and 0.240M solutions. You are provided the following glassware: 5.0 mL Mohr pipet and 18 mm x 150 mm test tubes. Describe how you would prepare each solution, and support your description with your calculations. (Recall (Mc x Vc = Md x Vd) where Mc is the molarity of the concentrated solution, Vc is the volume of the concentrated solution, Md is the molarity of the dilute solution, and Vd is the volume of the diluted solution.)
Given 0.400 M Co(NO3)2 solution.
Lets say we pipette out 5 mL of this solution and dilute it to get 0.160 M solution. Then
Using, Mc x Vc = Md x Vd
0.400 x 5 = 0.160 x Vd or Vd= (0.400 x 5)/0.160 = 12.5 mL
Thus we need to add 7.5mL distilled water to 5 mL of cobalt nitrate. Since we are only provided with a 5 mL pipette, we can only measure out volumes in multiple of 5.
thus pipette out (5 x 2) 10 mL of cobalt nitrate solution in the test tube and dilute it by addition of (7.5 x2) 15 mL of distilled water.
Again for preparing 0.240 M solution
Lets say we pipette out 5 mL of this solution and dilute it to get 0.160 M solution. Then
Using, Mc x Vc = Md x Vd
0.400 x 5 = 0.240 x Vd or Vd= (0.400 x 5)/0.240 = 8.33 mL
Thus we need to add 3.33mL distilled water to 5 mL of cobalt nitrate. Again taking volumes only in multiples of 5, pipette out (5 x 3) 15 mL of cobalt nitrate solution in the test tube and dilute it by addition of (3.33 x3) 10 mL of distilled water.
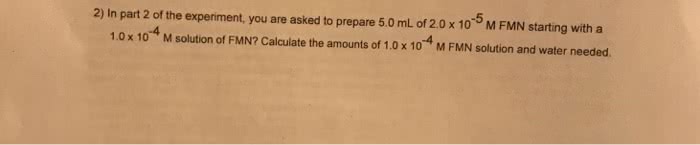
2. In your own words, explain, in detail, what you will be learning during this lab. Address the chemical principles and, laboratory skills, in your answer.
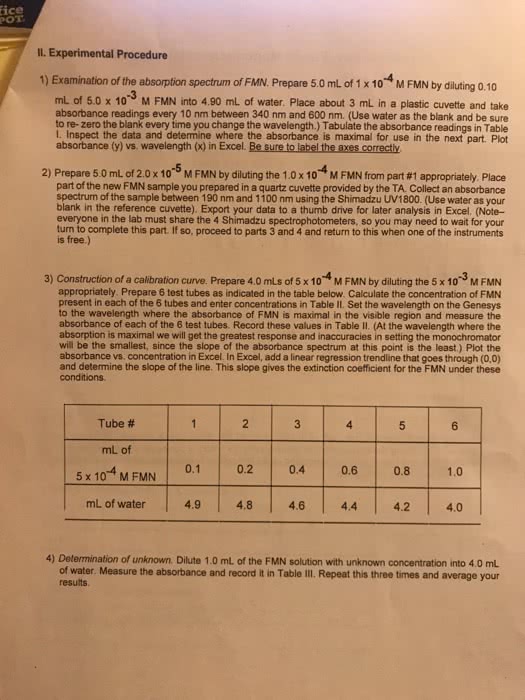
Post - Lab Questions:
a) Letâs say, for a given concentration of salt solution, the maximum response at a wavelength maximum of 485nm, is 0.750. If an unknown solution is analyzed at a longer or shorter wavelength would the investigator obtain the same concentration for the Unknown solution? Explain why.
b) List all possible sources of errors that may result in this experiment.