MATH 321 Lecture Notes - Lecture 7: Pie Chart, Frequency Distribution, Design Of Experiments

30 Jun 2019
School
Department
Course
Professor
Document Summary
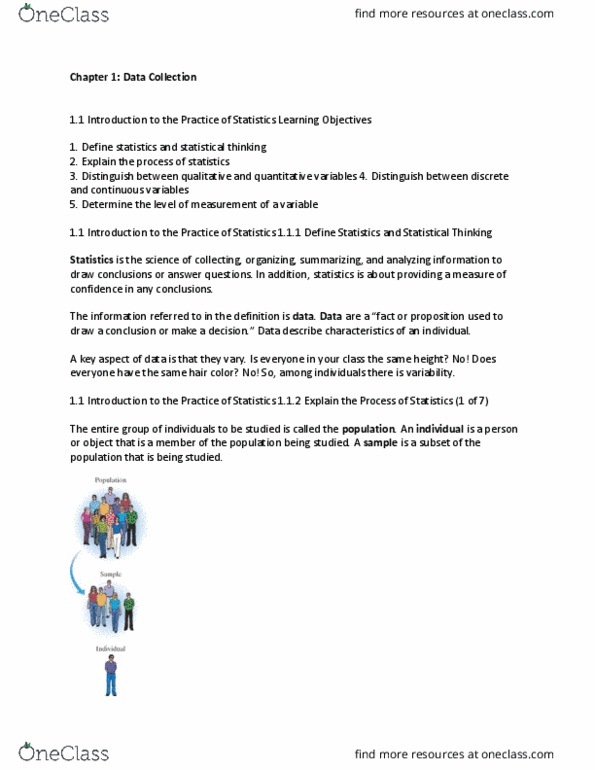
2. 1 organizing qualitative data learning objectives: organize qualitative data in tables 2. When data is collected from a survey or designed experiment, they must be organized into a manageable form. Data that is not organized is referred to as raw data. Ways to organize data tables: graphs, numericalsummaries(chapter3) 2. 1. 1 organize qualitative data in tables (1 of 8) A frequency distribution lists each category of data and the number of occurrences for each category of data. 2. 1. 1 organize qualitative data in tables (2 of 8) Example organizing qualitative data into a frequency distribution. The data on the next slide represent the color of m&ms in a bag of plain m&ms. Construct a frequency distribution of the color of plain m&ms. 2. 1. 1 organize qualitative data in tables (3 of 8) 2. 1. 1 organize qualitative data in tables (4 of 8) 2. 1. 1 organize qualitative data in tables (5 of 8)