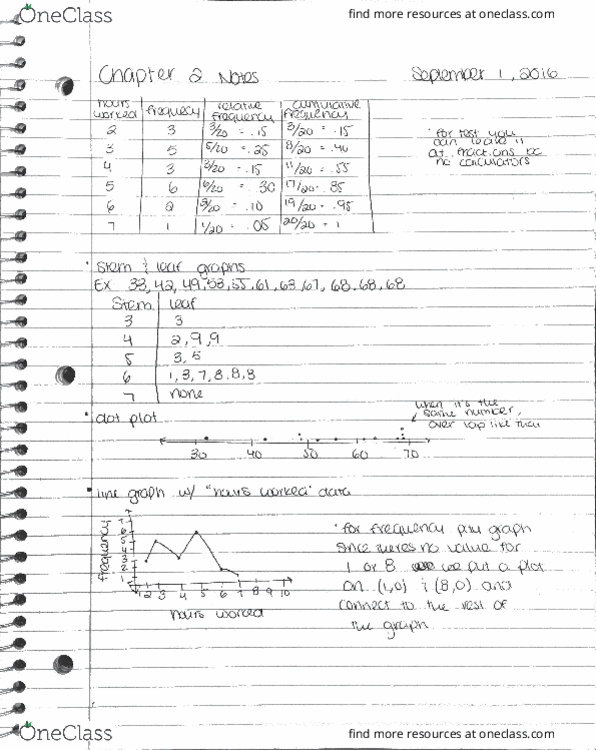
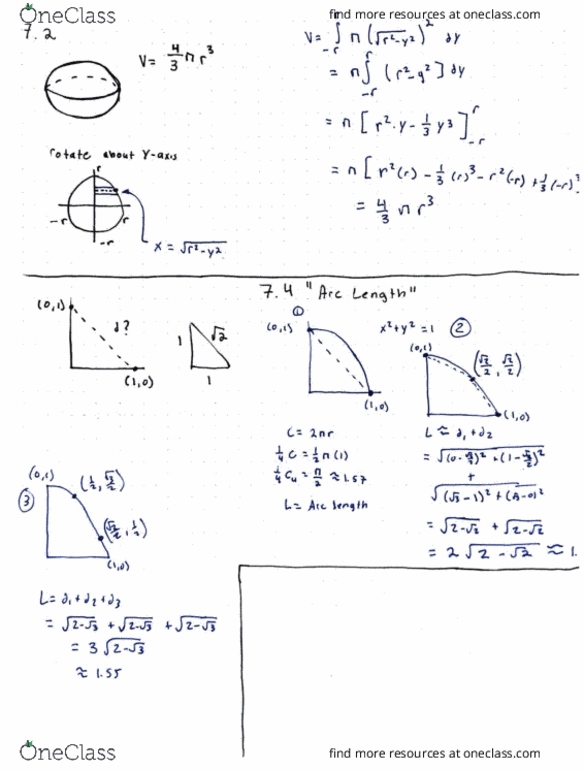
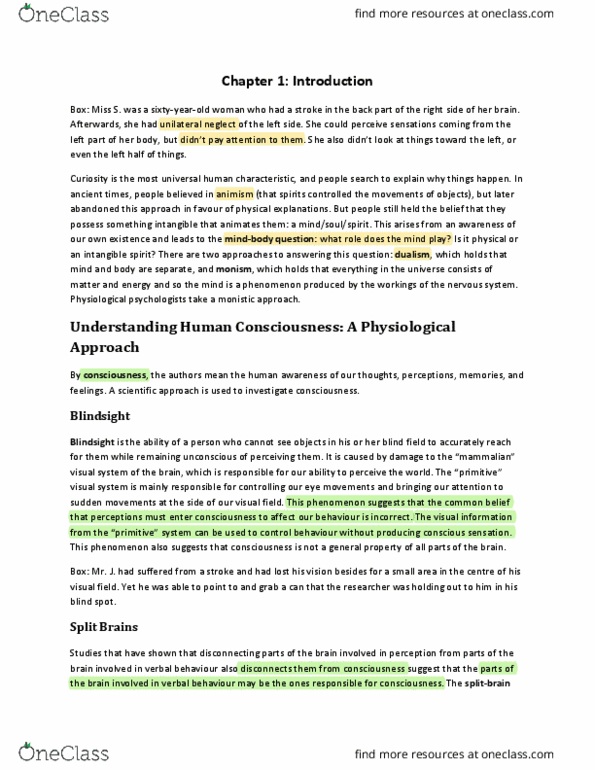
ART-201 Lecture 1: ART-201 Lecture
176 views3 pages

Get access
Grade+
$40 USD/m
Billed monthly

Homework Help
Study Guides
Textbook Solutions
Class Notes
Textbook Notes
Booster Class
10 Verified Answers
Class+
$30 USD/m
Billed monthly

Homework Help
Study Guides
Textbook Solutions
Class Notes
Textbook Notes
Booster Class
7 Verified Answers
Related Documents
Related Questions

calculate the misery index values using the data below, to exactly identify the year in which the index value was the highest. Explain what that value means.
| Frequency: Annual | ||
| observation_date | UNRATE | CPIAUCSL_PC1 |
| 1970-01-01 | 5.0 | 5.9 |
| 1971-01-01 | 6.0 | 4.2 |
| 1972-01-01 | 5.6 | 3.3 |
| 1973-01-01 | 4.9 | 6.3 |
| 1974-01-01 | 5.6 | 11.0 |
| 1975-01-01 | 8.5 | 9.1 |
| 1976-01-01 | 7.7 | 5.8 |
| 1977-01-01 | 7.1 | 6.5 |
| 1978-01-01 | 6.1 | 7.6 |
| 1979-01-01 | 5.9 | 11.3 |
| 1980-01-01 | 7.2 | 13.5 |
| 1981-01-01 | 7.6 | 10.4 |
| 1982-01-01 | 9.7 | 6.2 |
| 1983-01-01 | 9.6 | 3.2 |
| 1984-01-01 | 7.5 | 4.4 |
| 1985-01-01 | 7.2 | 3.5 |
| 1986-01-01 | 7.0 | 1.9 |
| 1987-01-01 | 6.2 | 3.6 |
| 1988-01-01 | 5.5 | 4.1 |
| 1989-01-01 | 5.3 | 4.8 |
| 1990-01-01 | 5.6 | 5.4 |
| 1991-01-01 | 6.9 | 4.2 |
| 1992-01-01 | 7.5 | 3.0 |
| 1993-01-01 | 6.9 | 3.0 |
| 1994-01-01 | 6.1 | 2.6 |
| 1995-01-01 | 5.6 | 2.8 |
| 1996-01-01 | 5.4 | 2.9 |
| 1997-01-01 | 4.9 | 2.3 |
| 1998-01-01 | 4.5 | 1.5 |
| 1999-01-01 | 4.2 | 2.2 |
| 2000-01-01 | 4.0 | 3.4 |
| 2001-01-01 | 4.7 | 2.8 |
| 2002-01-01 | 5.8 | 1.6 |
| 2003-01-01 | 6.0 | 2.3 |
| 2004-01-01 | 5.5 | 2.7 |
| 2005-01-01 | 5.1 | 3.4 |
| 2006-01-01 | 4.6 | 3.2 |
| 2007-01-01 | 4.6 | 2.9 |
| 2008-01-01 | 5.8 | 3.8 |
| 2009-01-01 | 9.3 | -0.3 |
| 2010-01-01 | 9.6 | 1.6 |
| 2011-01-01 | 8.9 | 3.1 |
| 2012-01-01 | 8.1 | 2.1 |
| 2013-01-01 | 7.4 | 1.5 |
| 2014-01-01 | #N/A | #N/A |