PSYC 2530 Lecture Notes - Lecture 2: Sample (Statistics), Centroid, Frequency Distribution

20 Sep 2016
School
Department
Course
Professor
Document Summary
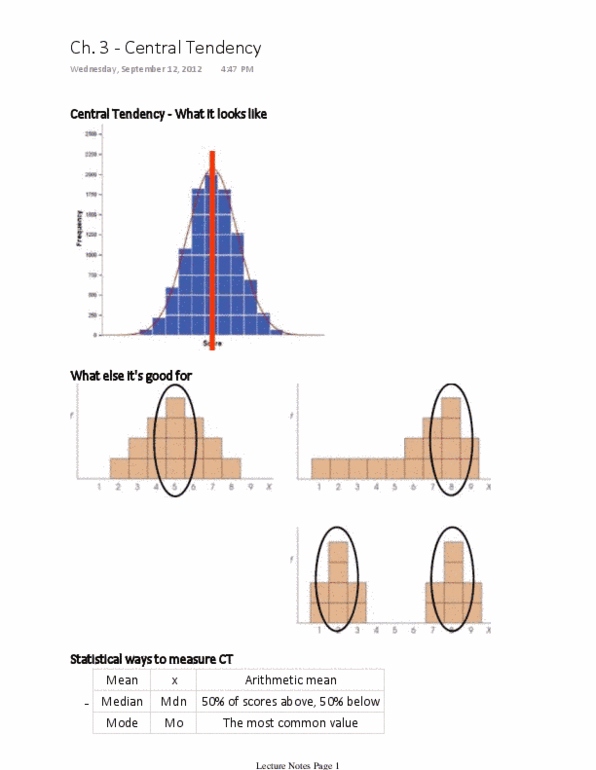
Goal: quickest summary of the variable being measured in a sample: a typical value. Intuition: common normal ordinary usual typical popular average mean value. Normal situation: the typical value is found at the center of the frequency distribution, so it is also called the central tendency . Frequency distribution: table or histogram (plot) of how often each value occurs in sample/pop"n. Mean: average , centroid, balance point: calculation: Sum of all values / # of values summed x = x / n: notation: Frequency distribution has extreme scores: mean is not central. Data are recorded on an ordinal scale: mean calculation impossible or nonsense. The 50-50 value (50% scores on each side): calculation: If n is odd: the score in the middle. If n is even: two middle scores/2: generalization: centiles, value: Point/category with the largest frequency in the frequency distribution. Calculation: graphical/numerical inspection, depends on the classes/groupings used. Value: only measure you can use with nominal data.