KINE 1000 Lecture Notes - Statistical Inference, Level Of Measurement, Analysis Of Variance

13 May 2018
School
Department
Course
Professor

Intro to KINE 2050 Instructor #3 – Brad Meisner
CHI square, textbook reading: Page 303-327
ANOVA: Page 207-255
Statistical Tests: Classifications
1. Parametric Statistical Test
- Analysis of continuous types of data. Interval and ratio. Makes assumptions, or
‘parameters’, about the normality of sample data collected, and estimating it to the
population distribution the sample aims to represent.
- ANOVA test
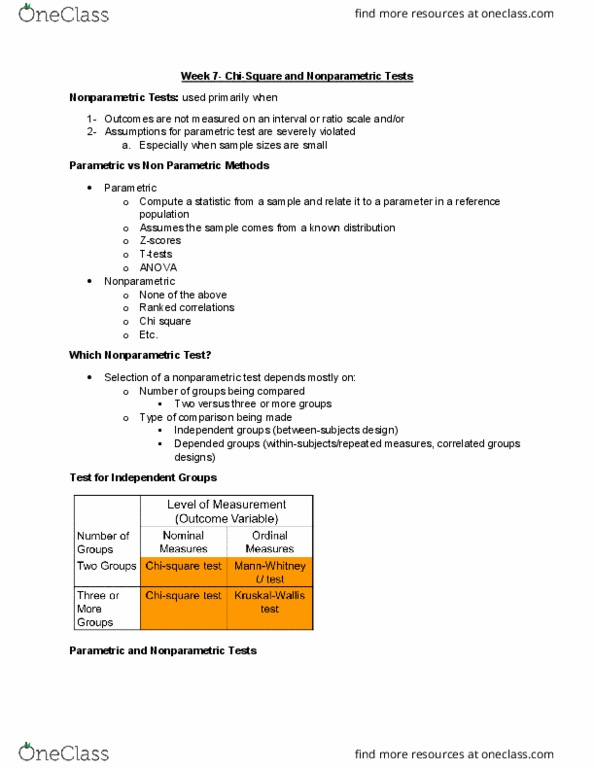
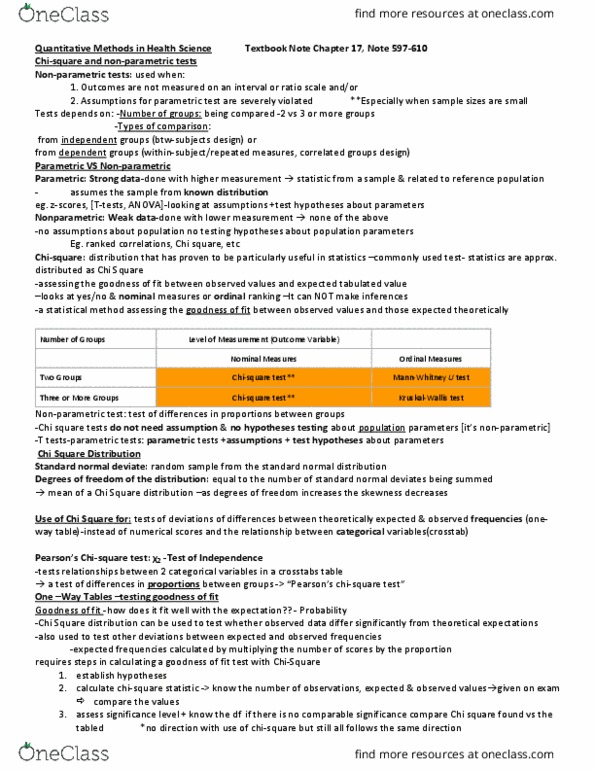
2. Nonparametric Statistical Test
- Not all data is continuous! Some are discontinuous. Nominal. Not all stat tests have
extensive parameters. Sometimes called “distribution-free statistics”.
- Ex. Chi square test
- Not as powerful as parametric tests because they are more result in TYPE 1 errors
(false positive results – when something is significant when its actually not)
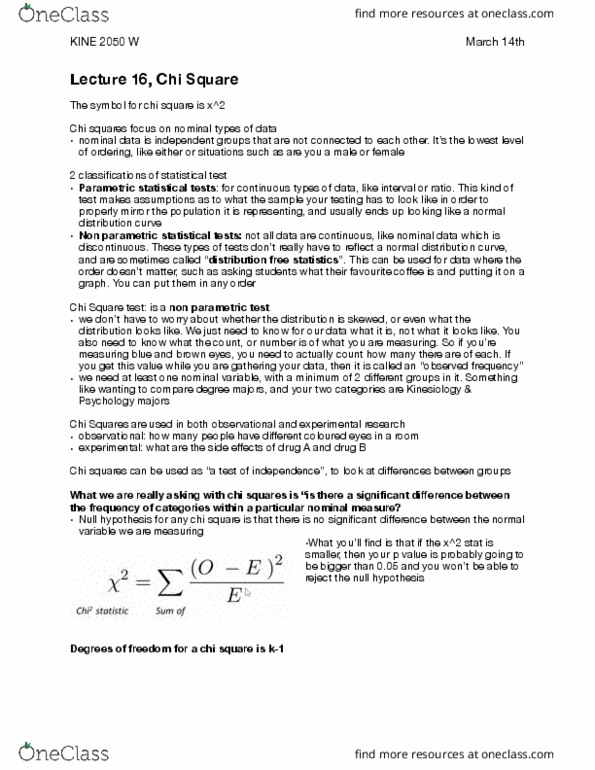
CHI Square Test
- What the data we collected is, not what it looks like
- Requires a minimum of 1 nominal variable/measure, which has a minimum of 2
different categories/groups
- Each category/group of a measure needs to have a number of participants or
observations that fit that classification.
o It is based on counts, called ‘observed frequencies’
- Used in both observational and experimental research
- Used in both descriptive and inferential statistics
- Can be used as a test of independence that examines difference between
categories/groups
- Essentially, we are asking, if there a statistically significant difference between the
frequencies of categories/groups of this variable/measure?
- NOMINAL VARIABLE – coin toss!
ANOVA: Analysis of Variance
- Used to make comparison among over 3 groups. Dependant variable is continuous
(interval or ratio data). Independent variable is categorical (nominal data).
- An inferential test that determines differences
- Used in experimental and observational research.
- Parametric: dependant variable is continuous
NULL Hypothesis: no differences exist among the populations/groups. Means of all the
populations/groups are equal. Mean1=mean2=mean3
ALTERNATIVE Hypothesis: differences exist among the populations/groups. Means among the
population/groups are not all equal. At least one mean is significantly different.
find more resources at oneclass.com
find more resources at oneclass.com
Document Summary
Intro to kine 2050 instructor #3 brad meisner. Parameters", about the normality of sample data collected, and estimating it to the population distribution the sample aims to represent. Not as powerful as parametric tests because they are more result in type 1 errors (false positive results when something is significant when its actually not) What the data we collected is, not what it looks like. Requires a minimum of 1 nominal variable/measure, which has a minimum of 2 different categories/groups. Each category/group of a measure needs to have a number of participants or observations that fit that classification: it is based on counts, called observed frequencies". Used in both observational and experimental research. Used in both descriptive and inferential statistics. Can be used as a test of independence that examines difference between categories/groups. Used to make comparison among over 3 groups. Dependant variable is continuous (interval or ratio data). Null hypothesis: no differences exist among the populations/groups.