ECON 3411 Lecture Notes - Lecture 21: Coefficient Of Determination, Total Variation, Dependent And Independent Variables

19 Jan 2018
School
Department
Course
Professor
Document Summary
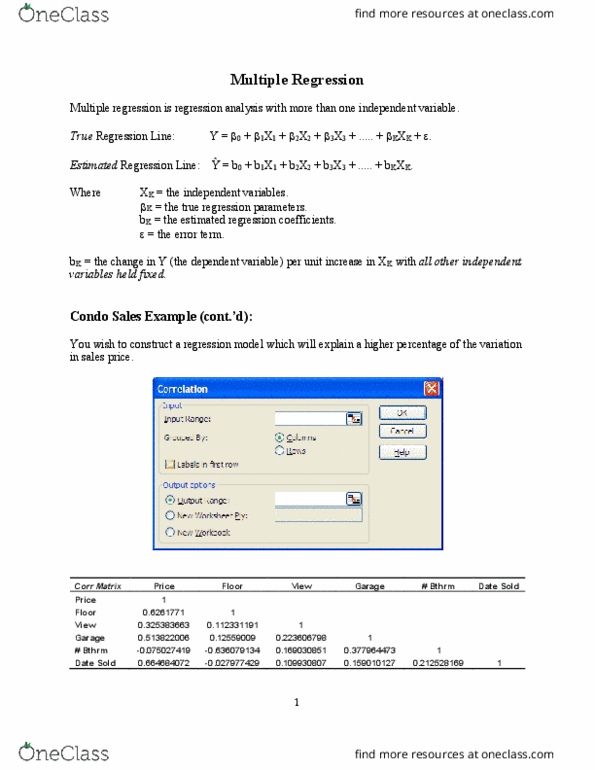
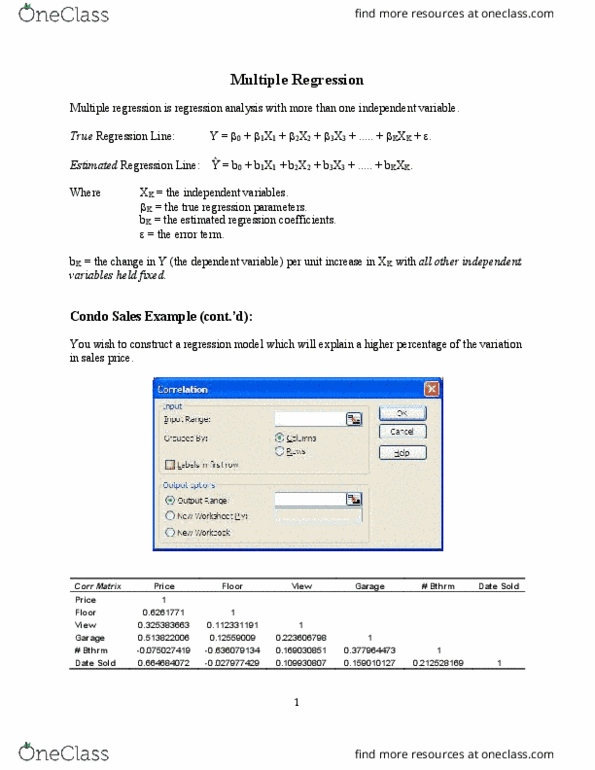
Topic: evaluating overall regression line fit: r- square: r-square. Fraction of the total variation in the dependent variable that is explained by the regression. Ranges between 0 and 1: values (cid:272)loser to 1 indi(cid:272)ate (cid:862)(cid:271)etter(cid:863) fit. Evaluating overall regression line fit: adjusted r-square: adjusted r-square. A version of the r-square that penalize researchers for having few degrees of freedom. Is the degrees of freedom for the regression. Evaluating overall regression line fit: f-statistic: a measure of the total variation explained by the regression relative to the total unexplained variation. The greater the f-statistic, the better the overall regression fit. Equivalently, the p-value is another measure of the f- statistic: lower p-values are associated with better overall regression fit. Regression for nonlinear functions and multiple regression: regression techniques can also be applied to the following settings: Functional relationships with multiple variables: multiple regression example: