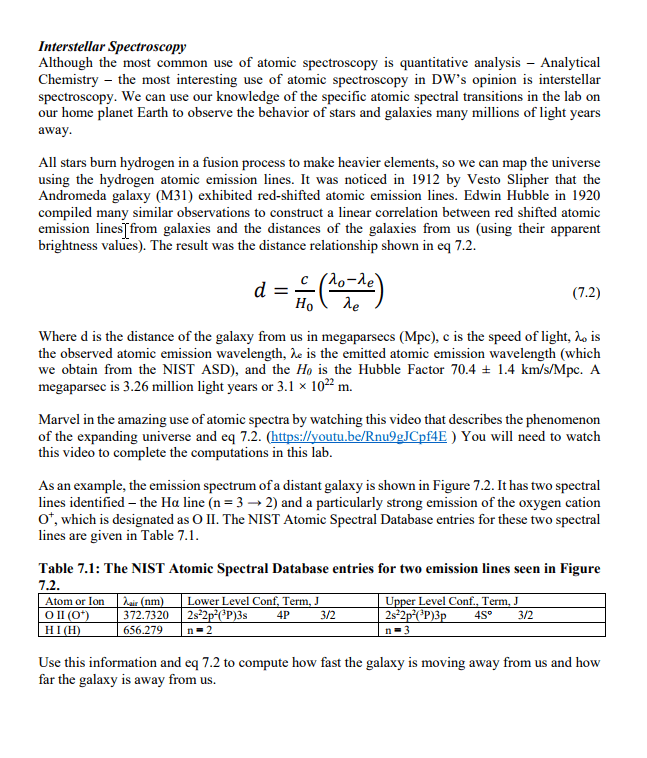
Use the NIST Atomic Spectral Database to assign the four brightest spectral lines for Li and He. In a table, list the transition wavelength, lower and upper state electron configurations, the lower and upper state term symbols, the lower and upper state J 71 values, and the lower and upper state degeneracies (http://physics.nist.gov/PhysRefData/ASD/lines_form.html). Hint, use a minimum Aki value to reduce the number of lines reported by the NIST search.
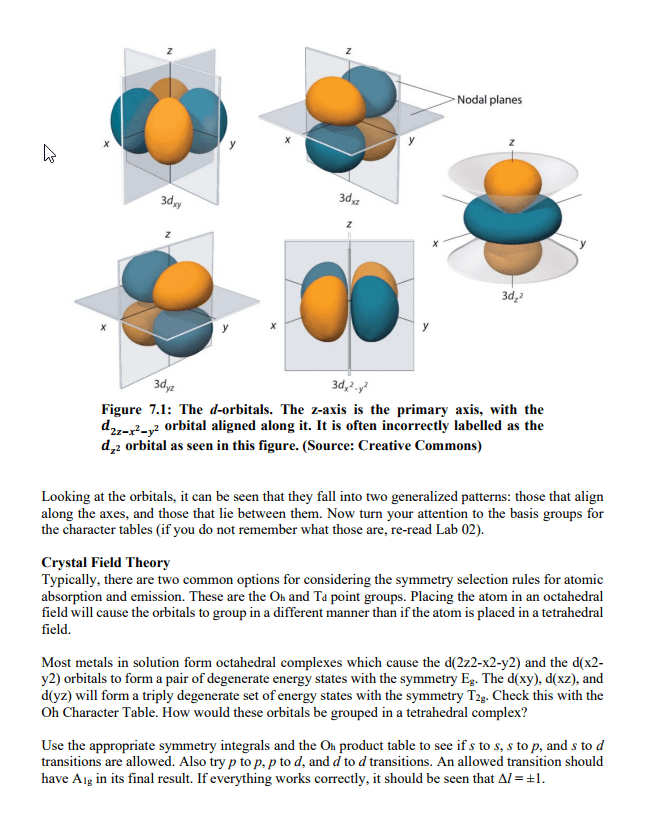
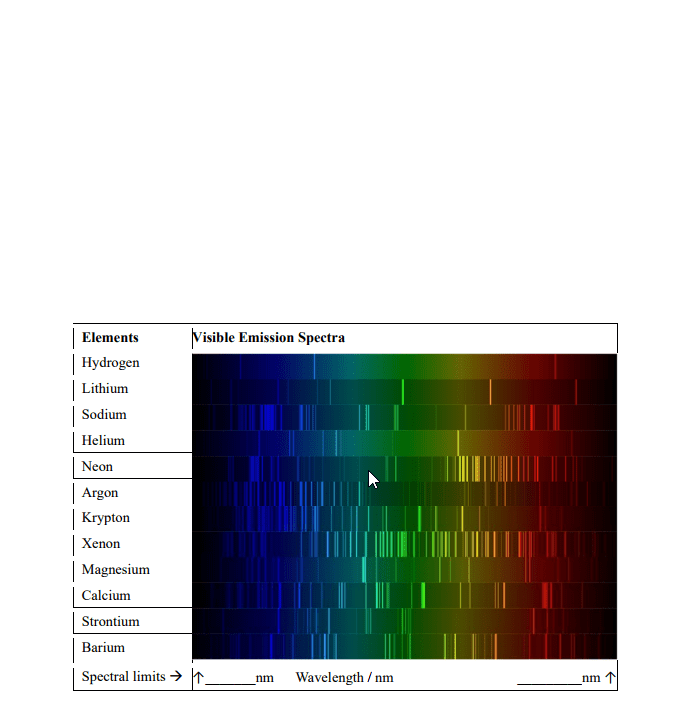
Abstract This physical chemistry laboratory exercise will have students work with provided emission spectra for several elements and data collected on the NIST Atomic Spectral Database. First, students will develop a method for calculating what wavelengths of visible light are associated with the most intense spectral lines in the provided visible emission spectra. Then, the NIST Atomic Spectral Database will be accessed in order to identify select properties associated with the four most intense spectral lines. Introduction The emission process can be described in two general parts. Initially, energy is absorbed by an atom, and its electrons can be moved into higher energy (excited) states from their ground state The excitedrelectrons then "relax" and drop back to their ground state. Energy lost during an electron's retaxation process is emitted as a photon. Recall that the energy of a photon is photon upper E lower Where Ephoton is the energy of the photon that is emitted when the emitter drops from an upper energy state to a lower energy state, h is Planck's constant, c is the speed of light, and v is the wavenumber. Remember that the length units should match for c and v This is a good time to revisit a few concepts. Atoms and molecules possess discrete energy levels their energy levels are quantized and not continuous. Using eq 7.1, it is possible to determine the energy associated with a specific excited state to ground state transition if we can determine the wavelength of emitted light. Also keep in mind that there are selection rules that limit the type of transitions we can expect to observe. All of these points are reflected in an elemental or ionic emission spectrum. The visible light spectrum falls within a fairly narrow range of wavelengths, from approximately 400 to 700 nm. Even so, discrete spectral lines are seen in each element's visible light emission spectrum. Each (take some time to reflect on why that would be), each element also has a unique emission spectrum. This provides a diagnostic tool for determining the composition of a sample. As an example, the elements present in celestial objects can be determined by the light that they produce line represents one possible transition. Since each element has unique energy levels Some of the transitions observed in this lab exercise involve d-orbitals. As such, a discussion regarding d-orbitals and related selection rules is necessary at this point. The first goal is to determine which character table should be used. Start by observing the shape and relative orientations of the d-orbitals. Refer to Figure 1 below