Statistical Sciences 1024A/B Lecture Notes - Lecture 4: Scatter Plot, Dependent And Independent Variables, Standard Deviation

25 Feb 2020
School
Department
Professor
Document Summary
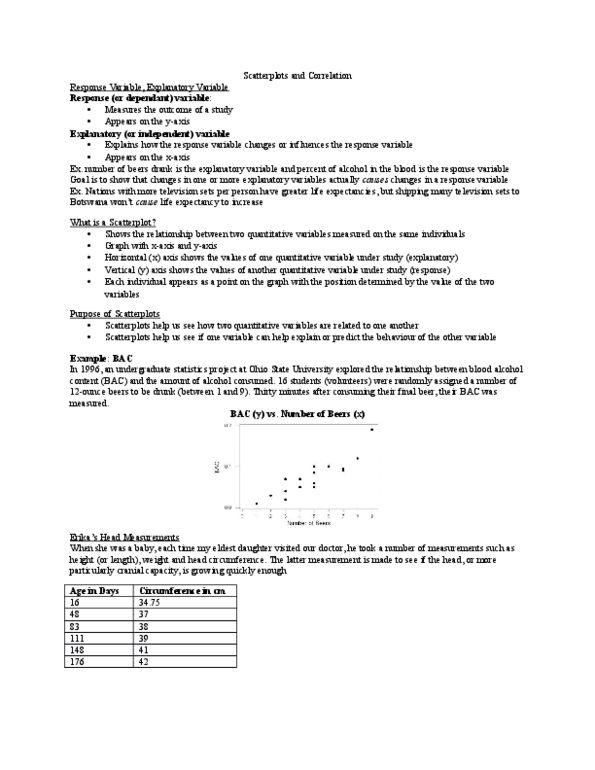
Chapter 4: scatterplots and correlation: relationship between two variables. Statistical relationships are overall tendencies, not ironclad rules. To understand a statistical relationship between two variables: measure both variables on the same individuals. Often relationship between two variables can be strongly influenced by other variables: explanatory and response variables. A response variable measures an outcome of a study. An explanatory variable may explain or influence changes in a response variable: scatterplot. The most useful graph for displaying the relationship between two quantitative variables is a scatterplot: a scatterplot shows the relationship between two quantitative variables measured on the same individuals. The values of one variable appear on the horizontal axis, and the values of the other variable appear on the vertical axis. As a reminder, we usually call the explanatory variable x and the response variable y. If there is no explanatory- response distinction, either variable can go on the horizontal axis.