Sociology 2206A/B Lecture Notes - Lecture 15: Multivariate Analysis, Analytic Induction, Univariate

26 Oct 2016
School
Department
Course
Professor
Document Summary
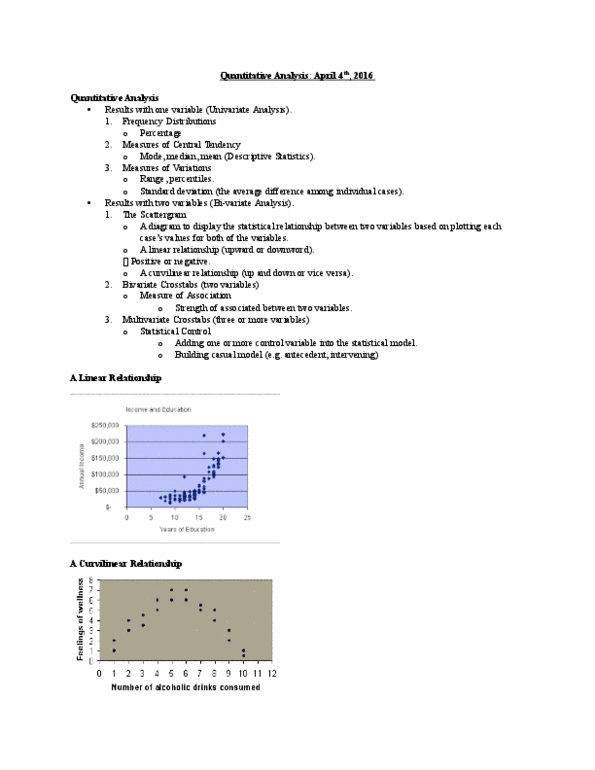
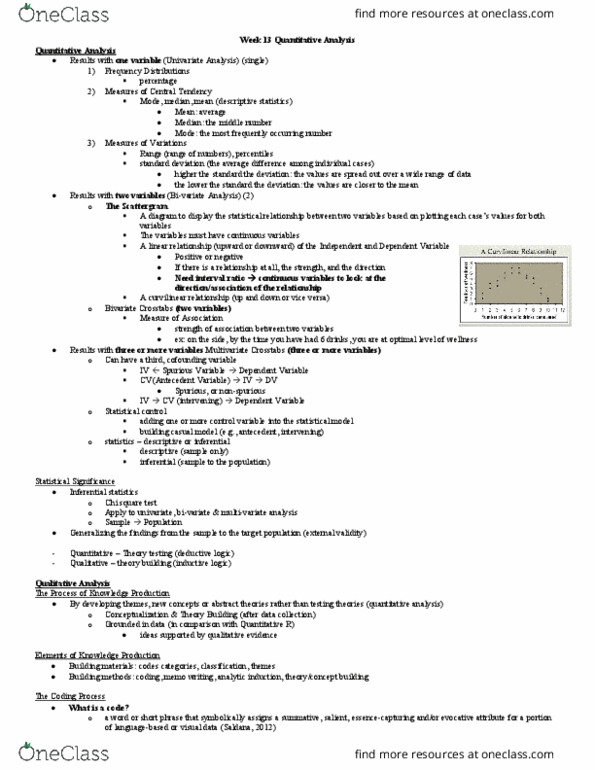
Quantitative analysis used to test theories and hypothesis. Result with one variable (univariate analysis: frequency distributions. Mode, median, mean (descriptive statistics: measures of variations. Standard deviation (the average difference among individual cases) Quantitative analysis - results with two variables (bi-variate analysis: the scattergram. A diagram to display the statistical relationship between two variable based on plotting each case"s values for both of the variables. A curvilinear relationship (up or down or vice versa: bivariate crosstabs (two variables) Strength of association between two variables: multivariate crosstabs (three or more variables) Adding one or more control variable into the statistical model. Apply to univariate, bi-variate and multivariate analysis. Generalizing the findings from the sample to the target population (external validity) Qualitative analysis presenting different social realities, different perspectives (producing knowledge and the reality) By developing themes, new concepts or abstract theirs rather than testing theories (quantitative analysis) Conceptualization & theory building (after data collected) Grounded in data (in comparison with quantitative.