Biology 2382B Lecture 3: Lecture 3

10 Mar 2018
School
Department
Course
Professor
Document Summary
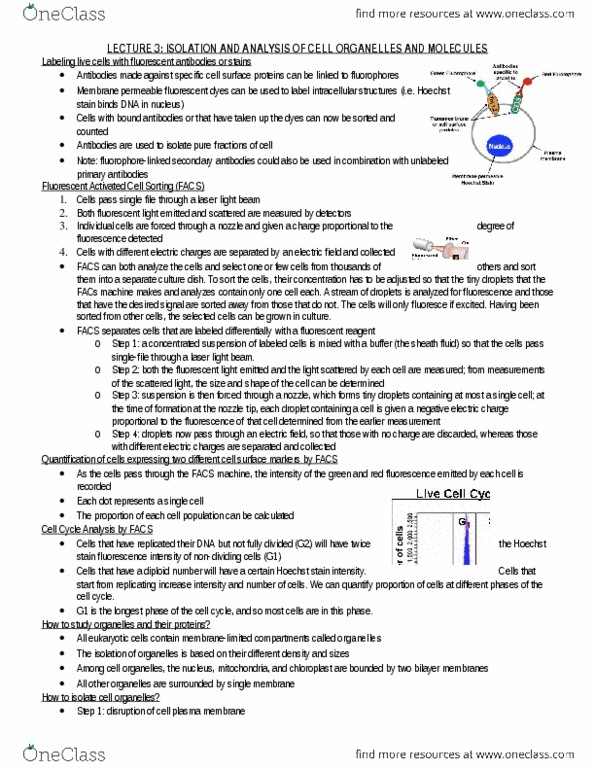
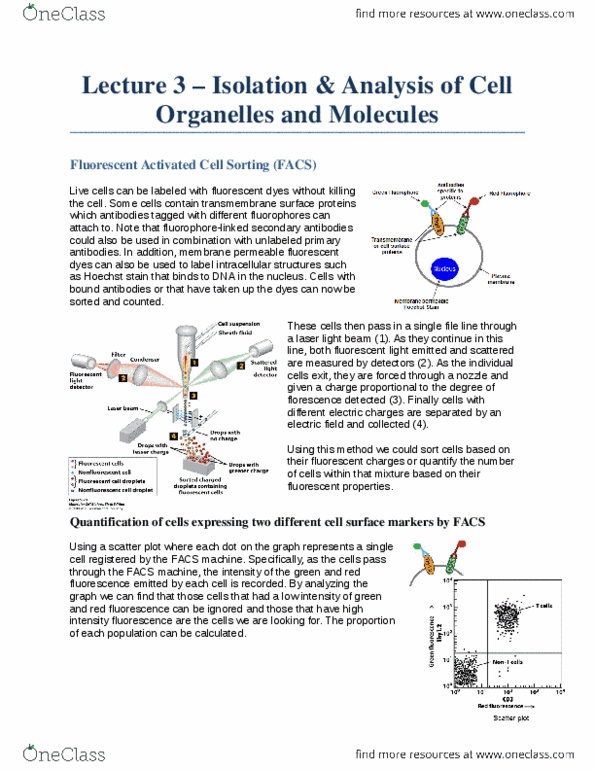
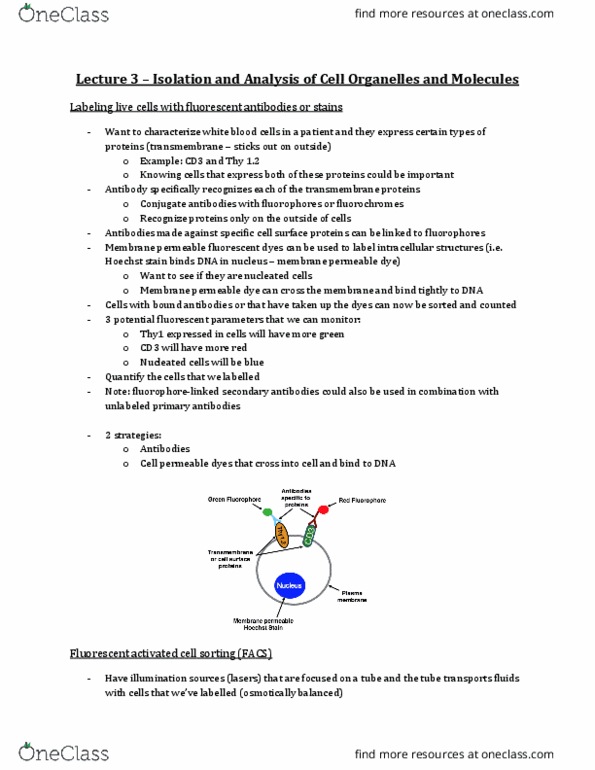
Lecture 3: isolation and analysis of cell organelles and molecules. 1: antibodies linked to fluorophores can be made against specific cell surface proteins, membrane permeable fluorescent dyes can be used to label intracellular structures, e. g. Hoechst stain binds to dna and fluoresces blue: cells that show fluorescence can be sorted and counted. Facs: sorts a heterogeneous mixture of cells based on their fluorescent characteristics: cells pass in a single file line through a laser light beam, fluorescent light emitted and scattered are measured by detectors. Quantification: facs can also record the intensity of fluorescence emitted by each cell: data is plotted in many different ways, e. g. scatterplot where each dot represents a different cell. X-axis is red fluorescence intensity, y-axis is green fluorescence intensity. Those high in both fluorescences contain both markers we are interested in: the proportion of each cell population can then be calculated.