SOC202H1 Lecture Notes - Total Variation, Standard Deviation, Null Hypothesis

Document Summary
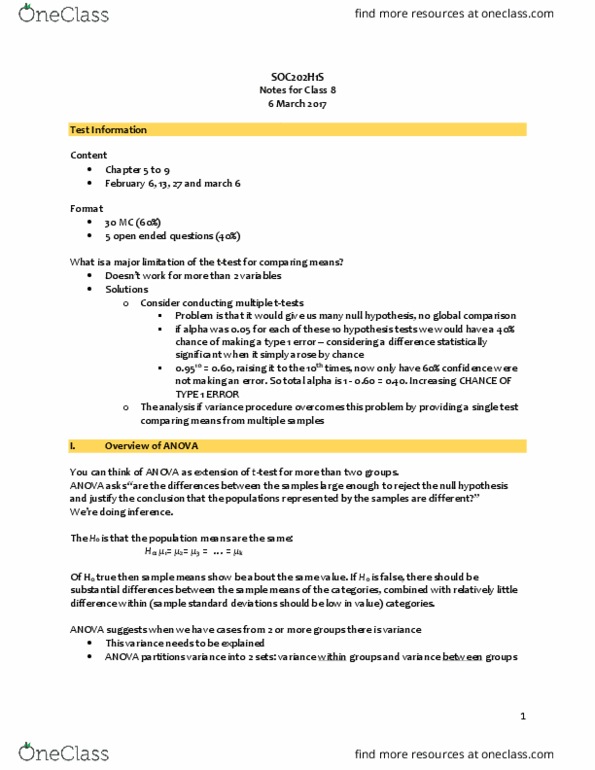
How on variance vary from one group to another. The t-test compares 2 groups f-test compares more than 2 groups. Does levels of x help us to understand variation in y. Mind a variable that explains percentage of variance. Example: 40% of the variation in class marks can be explained by class participation. Null hypothesis: there are no differences among group means in the population: we seek to build a case against the null hypothesis, example: family conflict is not randomly distributed in population. There are patterns such as self-employment people have higher family conflict. If hypothesis is true: higher education means lower divine belief. Less than a university degree (