MGEC81H3 Lecture Notes - Lecture 5: Statistical Process Control, Control Chart, Acceptance Sampling

17 Oct 2020
School
Department
Course
Professor
Document Summary
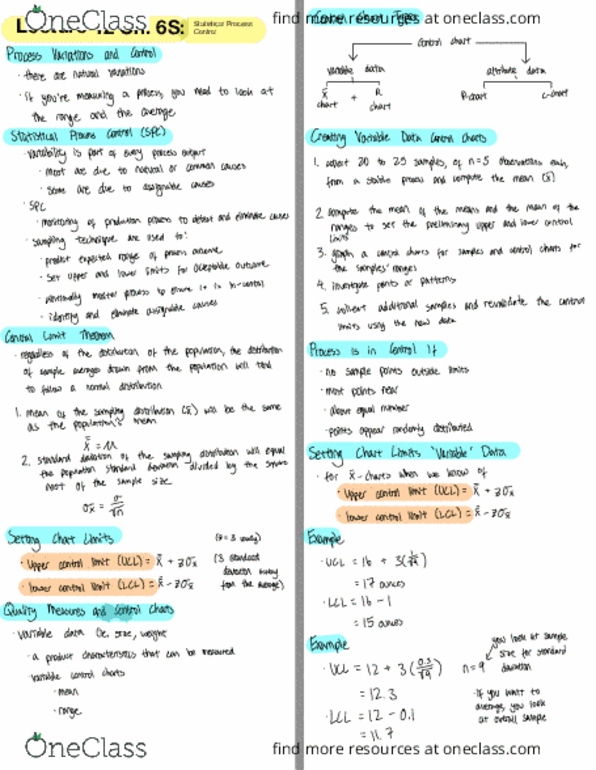
If only natural causes of variation are present, the output of a process forms a distribution that is stable over time and is predictable. If assignable causes are present, the process output is not stable over time and is not predictable. 2: control charts for variables - x -chart and r-chart, a quality characteristic measured via numerical scale is called a variable. Eg. length, width, temperature, volume: x -charts and r-charts can be used to monitor mean and variability of variables, suppose x = length of pipe, for sample of n observations, average = 2 n and range r = xmax xmin: for m-samples: Rd3: values of a2, d3, d4 are given in table s6. 1 for different sample size n. Following is flow width measurements (microns) for a hard-bake process for computer chips (wafers). Determine the center line and control limits for the x -chart and r-chart. X -chart if know population standard deviation.