CRM 2303 Lecture Notes - Lecture 8: Statistical Inference, Bar Chart, Skewness

1 May 2016
School
Department
Course
Professor

Document Summary
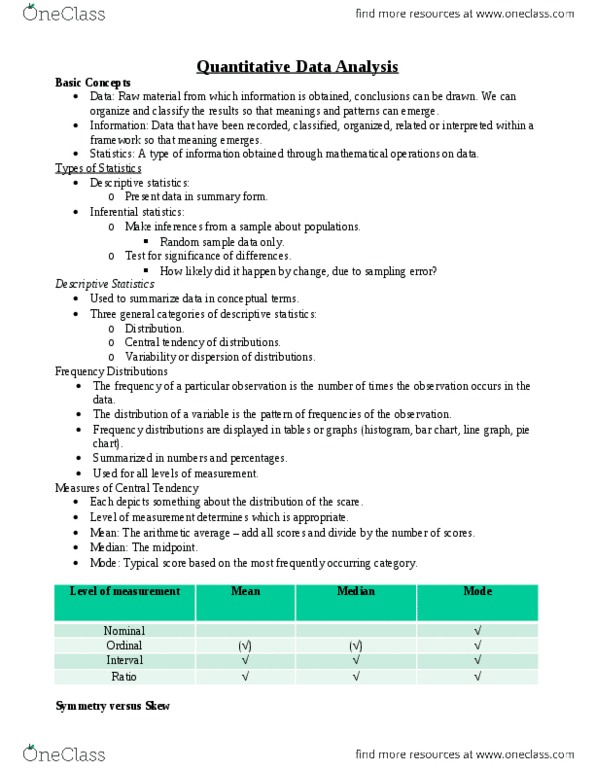
Data raw material from which information is obtained, conclusions can be drawn. Information data that have been recorded, classified, organized, related or interpreted within a framework so that meaning emerges. Statistics a type of information obtained through mathematical operations on data. 100 students in the 3. 0 to 9. 5 range. Make inferences from a sample about populations (random sample data only) Test for significance of differences (how likely did it happen by chance, due to sampling error?) Used to summarize data in conceptual terms. The frequency of a particular observation is the number of times the observation occurs in the data. The distribution of a variable is the pattern of frequencies of the observation. Frequency distributions are displayed in tables or graphs (histogram, bar chart, line graph, pie chart) Each depicts something about the distribution of the score. The arithmetic average adds all scores and divide by the number of scores. Typical score based on the most frequently occurring category.