STAT 1000 Lecture Notes - Lecture 21: Standard Deviation

10 Sep 2018
School
Department
Course
Professor
Document Summary
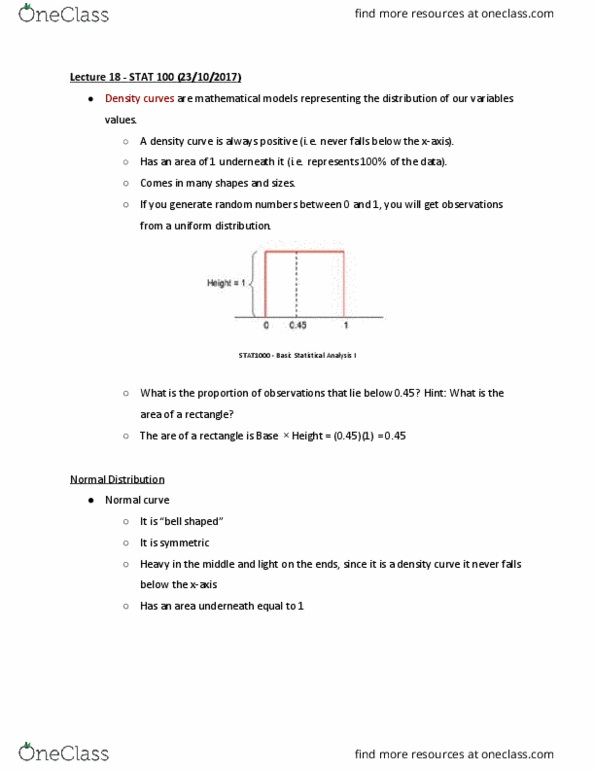
A density curve is always positive (i. e. never falls below the x-axis). Has an area of 1 underneath it (i. e. represents 100% of the data). Density curves comes in many shapes and sizes. If you generate random numbers between o and 1 , you will get observations from a uniform distribution. Is the population mean (the center, where the distribution is located) Is the population standard deviation (how concentrated the probability is about the mean) Both values must be standardized, we already know for x = Similarly we can find for x = 200, z = 0. 39. Take the area to the left of 1. 41 and subtract the area to the left of 0. 39. Scores on a university exam are normally distributed with a mean of 62 and a standard deviation of 11. A well-k(cid:374)ow(cid:374) (cid:373)aker of ja(cid:373)s a(cid:374)d jellies pa(cid:272)kages it"s ja(cid:373)s i(cid:374) jars la(cid:271)eled (cid:862)250(cid:373)l(cid:863).