PSYC 1010 Lecture Notes - Lecture 3: Nuisance Variable, Scatter Plot, Confounding

25 Mar 2016
School
Department
Course
Professor

Document Summary
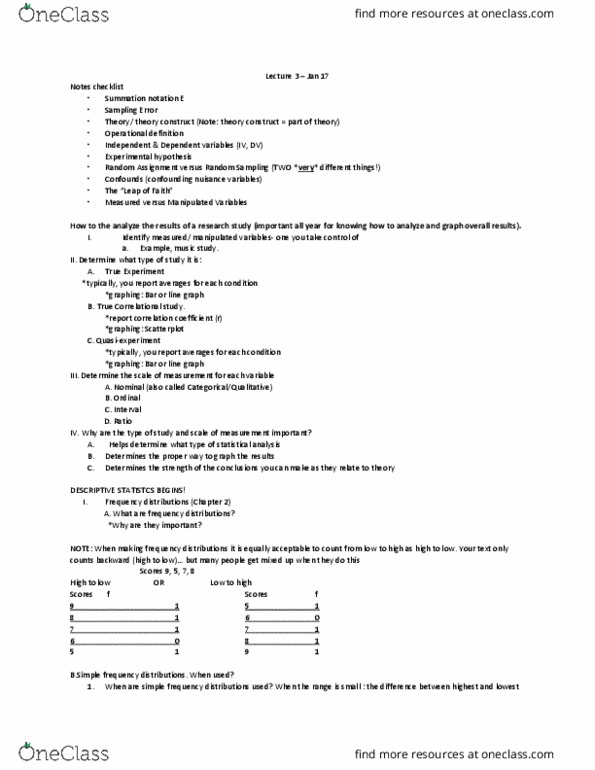
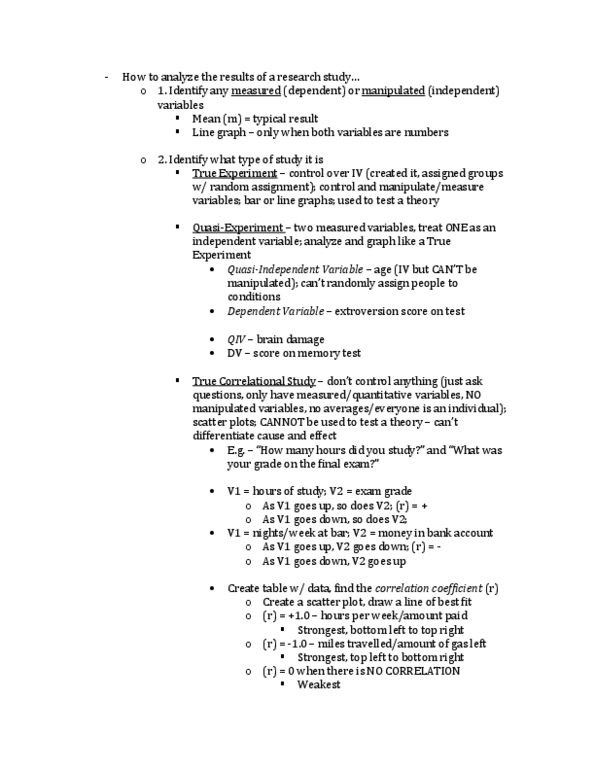
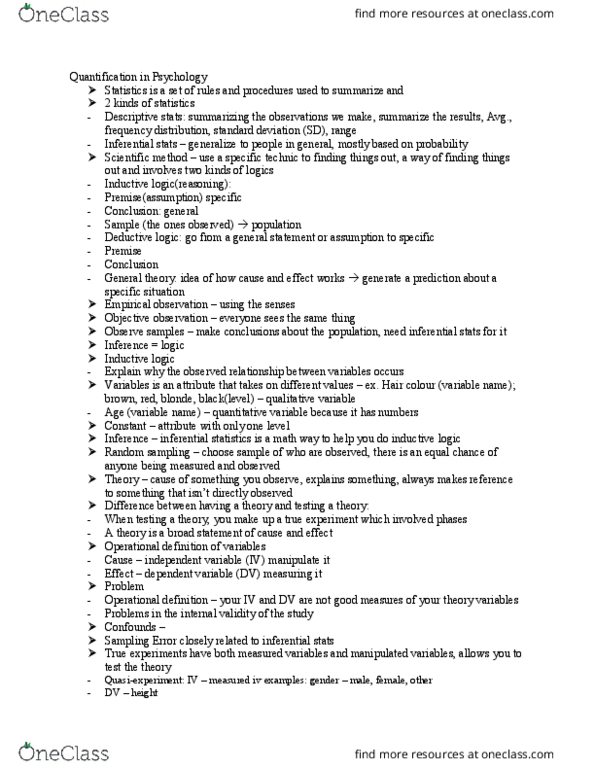
How to analyze the results of a research study coninued **important all year for knowing how to analyze and graph overall results** Be sure to include the operaional deiniion when describing variables. Idenify what type of study it is: true experiment. Both manipulated (true iv) and measured variables (dv) Can control nuisance variables things that vary in the experiment other than the dependent variable; you do not have control over these. Most dangerous is the confounding variable explains the associaion. Soluion: control by holding this nuisance variable constant. Soluion: random assignment so that there is no systemaic diference between the types of people. When reporing in terms of stats, report the measures of the typical person in each group average alertness raings this is called central tendency or average. When graphing, dv on y axis and iv on the x axis. Can use both a bar or line graph. Categorical (qualitaive) variable always use bar graph: correlaional study.