STAT151 Lecture Notes - Lecture 11: Regression Analysis, Confounding, Scatter Plot

30 Mar 2016
School
Department
Course
Professor


4
STAT151 Full Course Notes
Verified Note
4 documents
Document Summary
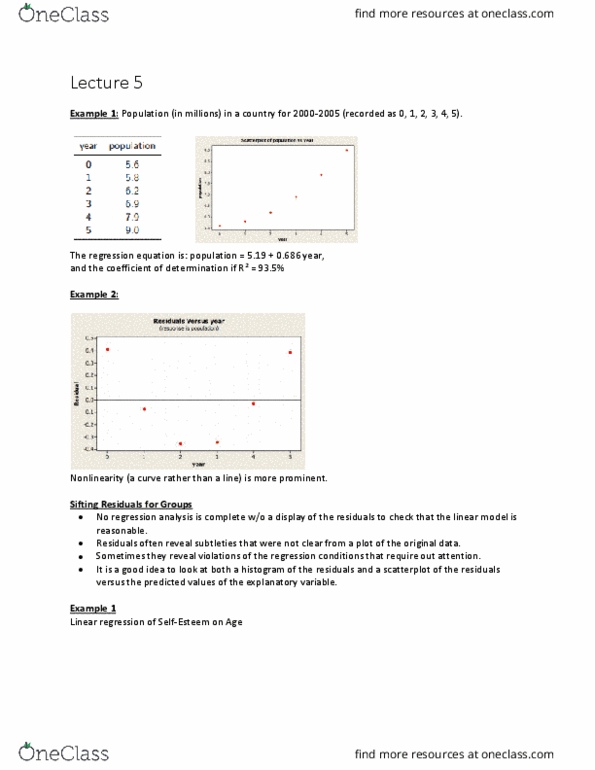
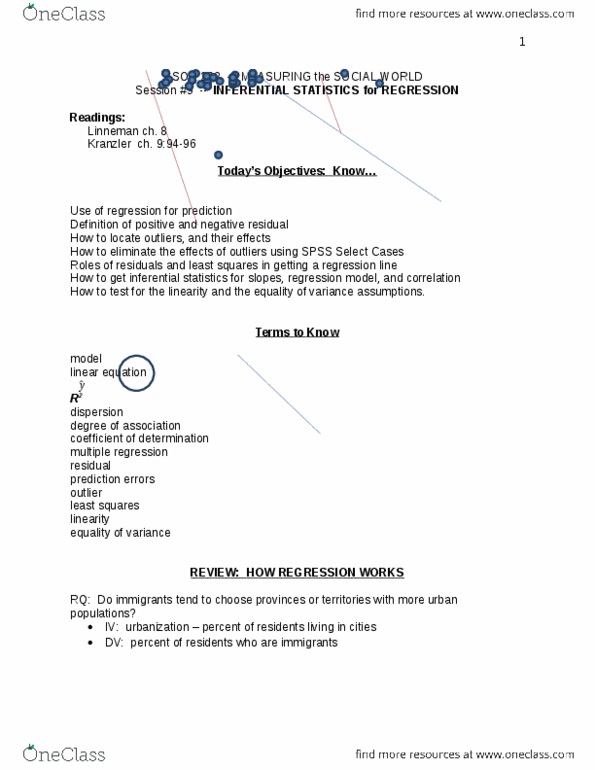
Linear regression only works for linear models. (that sounds obvious, but when you it a regression, you can"t take it for granted. ) A curved relaionship between two variables might not be apparent when looking at a scaterplot, but we can see important features such as nonlinearity more readily when you plot the residuals. A scaterplot of the dive heart rate (beats per minute) and the duraion (minutes) of dives by these high-tech penguins and its residual plots are given below. We see a slight non-linearity in the original scaterplot (let), but in residual plot, it is more clearer. No regression analysis is complete without a display of the residuals to check that the linear model is reasonable. Residuals oten reveal subtleies that were not clear from a plot of the original data. Someimes the subtleies we see are addiional details that help conirm or reine our understanding. Someimes they reveal violaions of the regression condiions that require our atenion.