CRIM 320 Lecture Notes - Lecture 8: Common Cause, Situation Two, Partial Correlation

9 Apr 2020
School
Department
Course
Professor
Document Summary
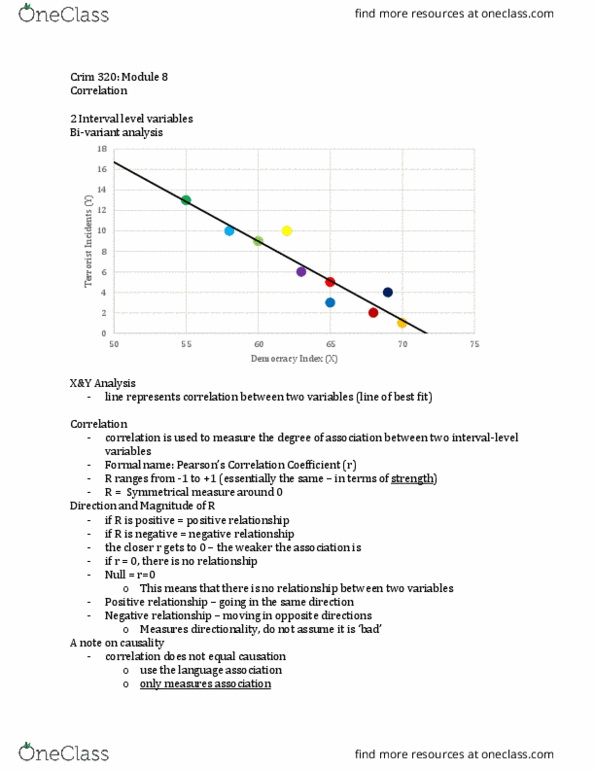
Need to understand what happens when we ploy x and y together. Data related to democracy index and terrorist incidents. Have 2 variables of interest, both which are interval. Ex: country 1 - democracy index was 86 and that year had 2 terrorist incidents. Need to figure out how to plot this data. Graphical representation of the relationship between the 2 variables. Line summarizes the relationship between x and y variables. When we push the line to touch the axis (regression) - related to intercepts. Correlation is used to measure the degree of association between 2 interval - level variables. Formal name pearson"s correlation coefficient (r ) In terms of strength of coefficient, -1 and + 1 are the same. If r is positive positive relationship (same direction) If r is negative negative relationship (opposite direction) The closer r gets to 0 the weaker the association is. If r = 0 there is no relationship.