QMS 102 Lecture Notes - Lecture 2: Histogram, Frequency Distribution, Ogive

23 Oct 2017
School
Department
Course
Professor

Document Summary
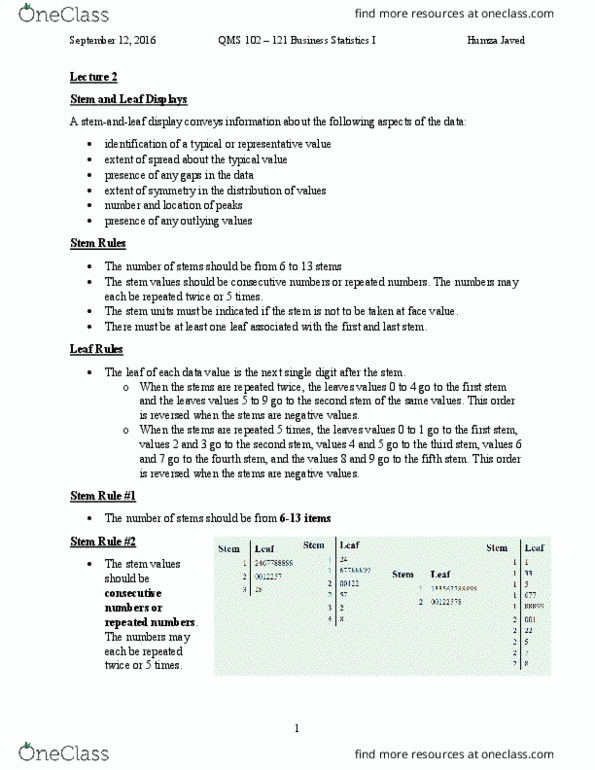
Review from lec 1: types of data, how to present nominal data (bar, pie, pareto charts), distribution tables, cross classification table, side-by-side chart, stem-and-leaf plot. Stem rules: number of stems should be from 6 to 13 stems, the stem values should be consecutive numbers or repeated numbers. The numbers may each be repeated twice or 5 times: the stem units must be indicated if the stem is not to be taken at face value, ex. Stem (10), stem digits are in the 10"s, leaves are 1"s: if nothing is specified stem is 1, leaves are . 1, there must be at least one leaf associated with the first and last stem. Order is reversed when stems are negative: there is no rounding off, the leaf values are written in ascending order when positive and descending order when negative (ex. 2, -1, 0, 1, 2, 3: values 5-9 go to the first stem, values 0-4 go to the second stem (ex.