MTH 380 Lecture Notes - Lecture 9: Point Estimation, Variance, Standard Deviation

Document Summary
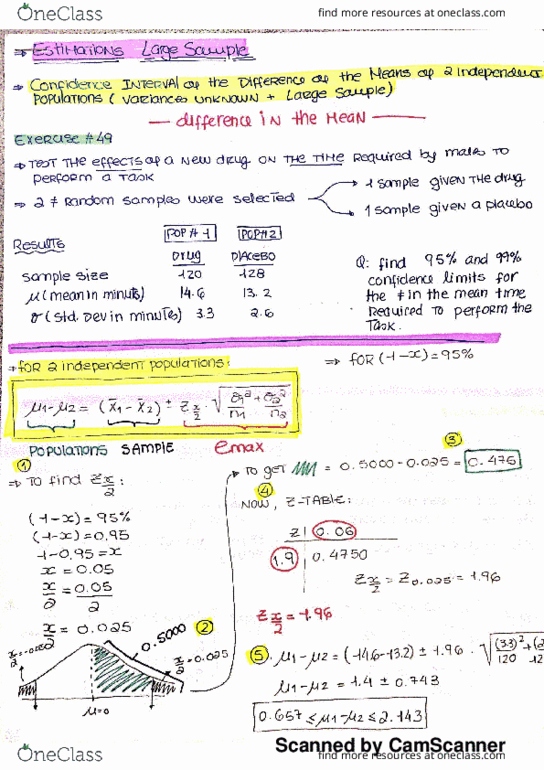
Assignment 9, estimating the difference between two population means and two population proportion. Independent random samples were selected from two quantitative populations. The sample sizes, sample means and variances are given in the table below: Find 90% and 99% confidence intervals for estimating the difference in population means. With 99% confidence: ch. 8. 4, review, 3, p. 330. 60 observations were selected from populations 1 and 2, respectively. The sample sizes and computed sample statistics are given in the table: Find 90% confidence intervals for the difference in population means. 1 correct to within 0. 2, with probability equal to 0. 95. If you plan to use equal sample sizes, how large should. 1: ch. 8. 4, 11, p. 311, ch. 8. 4, 12, p. 311. The experiment was carried to test the effect of a new drug on the time required by adult male in the performance of certain manual task. One sample was given the drug, while the other sample was administered a placebo.