GMS 402 Lecture Notes - Lecture 4: Total Variation, Explained Variation

30 Sep 2018
School
Department
Course
Professor
Document Summary
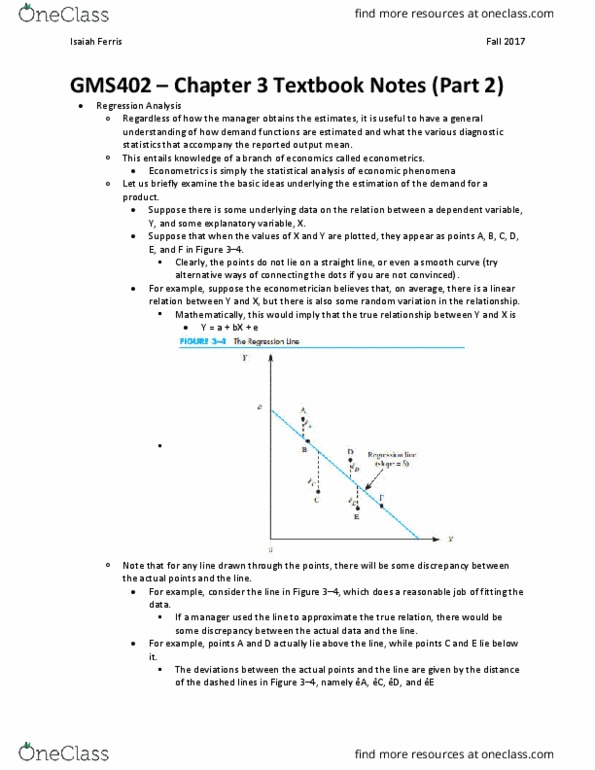
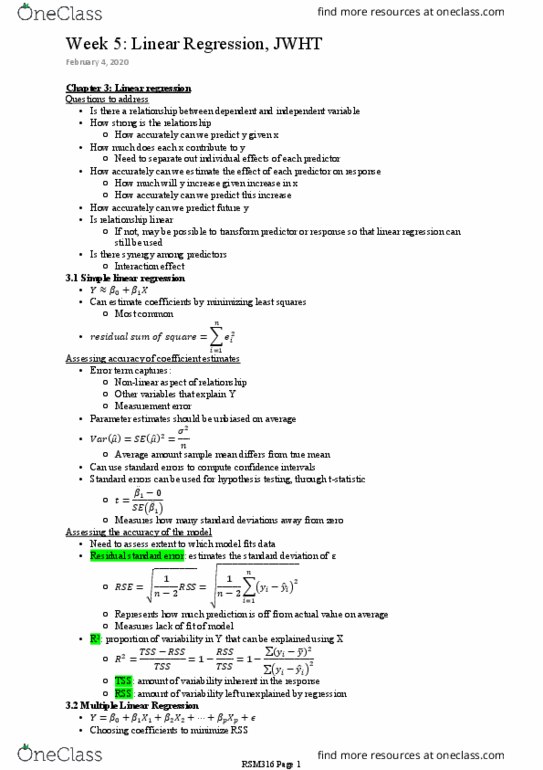
Regression analysis: estimates demand function, sum of least squares regression model: y = a + bx + e, sum of least squares regression line: Standard error: a measure of how much each estimated coefficient would vary in regression based on the same underlying relation, but with different observation, the smaller the standard error, the small the variation from different sample of data. If the parameter estimates of a regression equation are , the 95% confidence intervals of the true values can be approximated by t-statistic. If the t-statistic is greater than zero, that coefficient becomes irrelevant and its elasticity not affected by price change p-values: the lower the p-value for an estimated coefficient, the more confident you are in the estimate. If the p-value is greater than 0. 05, that coefficient becomes irrelevant and its elasticity is not affected by price change.