HLTHAGE 1BB3 Lecture Notes - Lecture 3: Dependency Ratio, Zero Population Growth, Combined Oral Contraceptive Pill

31 May 2016
School
Department
Course
Professor
Document Summary
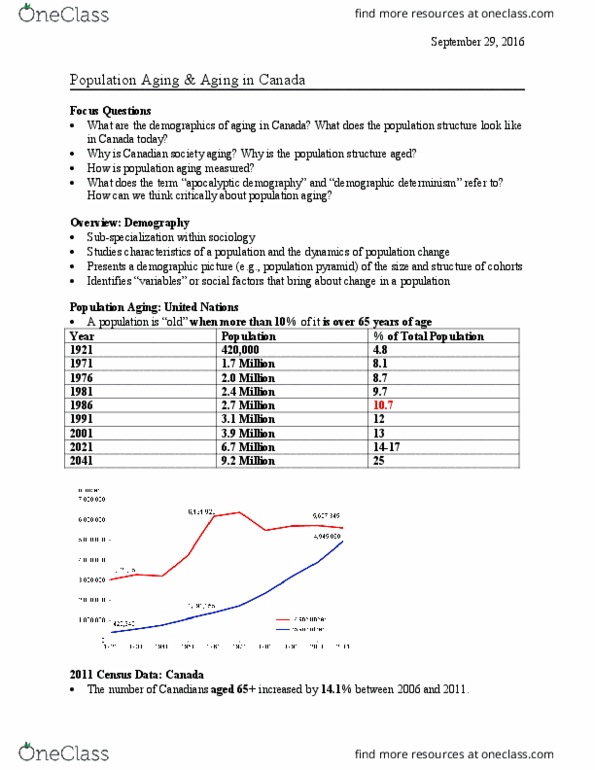
Wants to understand what social factors are, bringing change to the population. Population images: used to show/explain the population cohort (also known as population pyramids) Studies characteristics of a population and the dynamics of population change. Presents a demographic picture of the size and structure of cohorts. Identifies variables or social factors that bring about change in a population. A population is old when more than 10% of it is over 65 years of age. People aged 65+ made up record 14. 8% of the total population of canada. People aged 80+ topped the 1 million mark. The number of canadians aged 65+ increased by 14. 1% between 2006 and 2011. By comparison, the number of children aged 14 and under increased by only 0. 5% between. ******people aged 65+ made up a record 14. 8% of the total population of canada in 2011. Complex calculation based on fertility and morality rates. Based on the social roles (ethnicity, gender, wealth)