23115 Lecture Notes - Lecture 10: Classical Dichotomy, Longrun, Investment Goods


Lecture 10 - Aggregate Demand & Aggregate Supply
AGGREGATE DEMAND AND AGGREGATE SUPPLY (CH 31)
‐ Economic activity fluctuates from year to year.
o In most years, the production of goods and services rises.
➢ For example, the Australian real GDP has grown by about 2% per year on average over the past
50 years.
o In some years, this average growth does not occur.
• ➢ Recessions refer to a period of declining real incomes and rising unemployment.
• ➢ Depression refers to a severe and prolonged recession.
❖ I this hapte, e ill fous o shot‐u flutuatios i eooi atiit ad ill disuss:
• ‐ Key facts about economic fluctuations.
• ‐ An explanatory macro model of aggregate demand and aggregate supply.
THREE KEY FACTS ABOUT ECONOMIC FLUCTUATIONS
FACT #1 – ECONOMIC FLUCTUATIONS ARE IRREGULAR AND UNPREDICTABLE Fluctuations in
the economy are often called the business cycle.
Sometimes recessions occur close together, while at other times the economy goes many
years without a recession.
FACT #2 – MOST MACROECONOMIC QUANTITIES FLUCTUATE TOGETHER
Real GDP is the aiale that is ost ool used to oito shot‐u hages in the economy
because it is the most comprehensive measure of economic activity.
Real GDP measures the value of all final goods and services produced within a given period of time.
It also measures the total income (adjusted for inflation) in the economy.
It tus out, hoee, that fo oitoig shot‐u flutuatios, it does ot eall atte hih
measure of economic activity one looks at.
Most macroeconomic variables that measure some type of income, spending, or production will
fluctuate closely together.
When real GDP falls in a recession, so do personal income, corporate profits, consumer spending,
investment spending, industrial production, retail sales, home sales, auto sales, and so on. Because
eessios ae eoo‐ide pheoea, the sho up in many sources of macroeconomic data.
Although macroeconomic variables fluctuate together, they fluctuate by different amounts. FACT #3
– AS OUTPUT FALLS, UNEMPLOYMENT RISES
• ‐ There are exceptions to fact 2.
• ‐ The inverse relationship between economic growth and unemployment
• ‐ The inverse relationship between inflation and unemployment – Phillips Curve.
find more resources at oneclass.com
find more resources at oneclass.com

EXPLAINING SHORT RUN ECONOMIC FLUCTUATIONS
HOW THE SHORT RUN DIFFERS FROM THE LONG RUN
• ▪ In the long run, two related ideas are important – the classical dichotomy and monetary
neutrality. Changes in money supply (or the nominal interest rate) only affect nominal
variables, but never real variables in the long run.
Recall that the classical dichotomy is the separation of variables into real variables (those
that measure quantities or relative prices) and nominal variables (those measured in terms
of money).
According to classical macroeconomic theory, changes in the money supply affect nominal
variables but not real variables.
• ▪ Mainstream economists believe that classical theory describes the world in the long
run but not in the short run. Other economists disagree.
• ▪ According to conventional macro, it is only in the short run that the assumption of
monetary neutrality is inappropriate. This means that, in the short run, the classical
dichotomy does not apply so that real variables and nominal variables are highly
interrelated.
BASIC MODEL OF ECONOMIC FLUCTUATIONS
▪ Our model focuses on two variables.
1. The eoo’s output of goods and services as measured by real GDP (a real variable).
2. The inflation rate as measured by the time rate of change of the CPI or the GDP deflator (a
nominal variable).
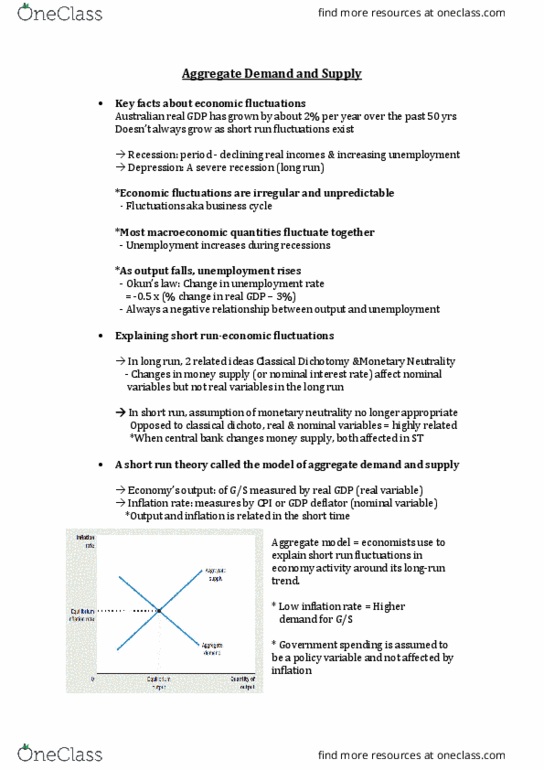
▪ The model of aggregate demand and aggregate supply is the model that most economists
use to eplai shot‐u flutuatios i eooi atiit aoud its log‐u ted.
Determines equilibrium inflation rate + equilibrium output, in the short run and the long run.
According to this model, the price level and the quantity of output adjust to bring aggregate demand
and aggregate supply into balance.
find more resources at oneclass.com
find more resources at oneclass.com

THE AGGREGATE DEMAND CURVE
▪ Aggregate‐dead AD ure is a curve that shows the quantity of goods and services that
households, firms, and the government want to buy at each price level.
• The AD curve is
doad‐slopig – othe thigs eual, a fall i the eoo’s iflatio ate teds to aise
the quantity of goods and services demanded.
• ➢ Wh is the AD ue doad‐slopig?
• ‐ GDP=Y=C+I+G+NX.
• ‐ Each component contributes to the aggregate demand for goods and services.
• ‐ Inflation and G – G is assumed to be a policy variable and is hence taken as exogenous.
1. Inflation and I – the INTEREST RATE EFFECT:
• ❖ Higher inflation rate induces the RBA to increase interest rates less spending on
investment goods lower aggregate demand.
• ❖ Lower inflation rate induces the RBA to reduce interest rates more spending on
investment goods higher aggregate demand.
‐ Thus, a lower price level reduces the interest rate, encourages greater spending on
investment goods, and thereby increases the quantity of goods and services demanded. 2. Inflation
and C – the WEALTH EFFECT (the Pigou effect):
• ❖ Higher inflation rate money holdings less valuable consumers feel less wealthy less
spending on consumption lower aggregate demand.
• ❖ Lower inflation rate money holdings more valuable consumers feel more wealthy
more spending on consumption higher aggregate demand.
‐ Thus, a decrease in the price level makes consumers feel wealthier, which in turn
encourages them to spend more. The increase in consumer spending means a larger
find more resources at oneclass.com
find more resources at oneclass.com
Document Summary
Lecture 10 - aggregate demand & aggregate supply. Economic activity fluctuates from year to year: in most years, the production of goods and services rises. For example, the australian real gdp has grown by about 2% per year on average over the past. 50 years: in some years, this average growth does not occur, recessions refer to a period of declining real incomes and rising unemployment, depression refers to a severe and prolonged recession. I(cid:374) this (cid:272)hapte(cid:396), (cid:449)e (cid:449)ill fo(cid:272)us o(cid:374) sho(cid:396)t (cid:396)u(cid:374) flu(cid:272)tuatio(cid:374)s i(cid:374) e(cid:272)o(cid:374)o(cid:373)i(cid:272) a(cid:272)ti(cid:448)it(cid:455) a(cid:374)d (cid:449)ill dis(cid:272)uss: An explanatory macro model of aggregate demand and aggregate supply. Fact #1 economic fluctuations are irregular and unpredictable fluctuations in the economy are often called the business cycle. Sometimes recessions occur close together, while at other times the economy goes many years without a recession. Fact #2 most macroeconomic quantities fluctuate together.