STAT3012 Lecture Notes - Lecture 13: Scatter Plot, Main Sequence, Symmetric Function

23 Jun 2018
School
Department
Course
Professor

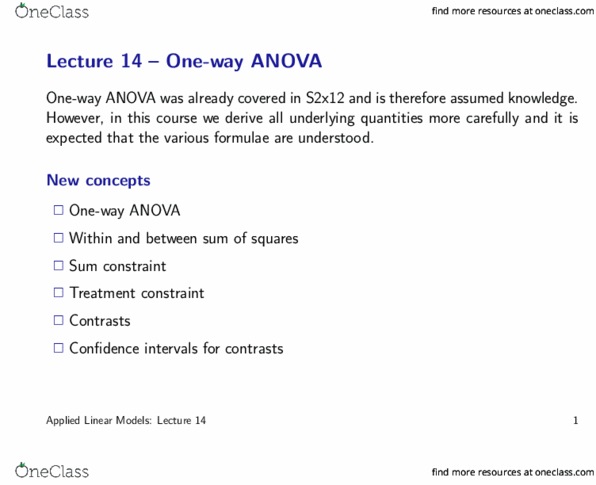
Lecture 1 - Robust regression
New concepts
✷Robustness and regression
✷Efficient and resistant regression
✷L1 regression
✷M estimation, MM estimation
✷Least-median-squares and least-trimmed-squares
This lecture complements the regression theory by presenting some alternatives to
the method of least squares.
Applied Linear Models: Lecture 1 1
find more resources at oneclass.com
find more resources at oneclass.com

New topic – Robust regression
References & further reading
✷Rousseeuw and Leroy (2005, Chapter 1–3). Robust Regression and Outlier De-
tection, New York: Wiley.
✷Venables and Ripley (2003, Chapter 6). Modern Applied Statistics with S (4e).
New York: Springer.
Edgeworth (1887)
The method of Least Squares is seen to be our best course when we have
thrown overboard a certain portion of our data – a sort of sacrifice which
has often to be made by those who sail upon the stormy seas of Probability
Applied Linear Models: Lecture 1 2
find more resources at oneclass.com
find more resources at oneclass.com

Theory – x-outliers and y-outliers
✷Outliers 6=extreme points, i.e. every univariate data set has a smallest and largest
observation.
✷Outliers are observations, which have a different underlying distribution/model
than the bulk of the data (recall lecture 8).
✷For regression data (Y,X)the different model can be in the x-space (e.g. high
leverage points) or in the y-space.
✷Cooks distance measures the ‘outlyingness’ based on both, Yand Xbut is only
‘powerful’ when single outliers are present.
Applied Linear Models: Lecture 1 3
find more resources at oneclass.com
find more resources at oneclass.com
Document Summary
This lecture complements the regression theory by presenting some alternatives to the method of least squares. Robust regression and outlier de- tection, new york: wiley. Outliers 6= extreme points, i. e. every univariate data set has a smallest and largest observation. Outliers are observations, which have a di erent underlying distribution/model than the bulk of the data (recall lecture 8). For regression data (y , x) the di erent model can be in the x-space (e. g. high leverage points) or in the y-space. Cooks distance measures the outlyingness" based on both, y and x but is only. Example phone calls library(mass) dat