STAT3012 Lecture Notes - Lecture 4: Scatter Plot, Structure Of Policy Debate, Joule

23 Jun 2018
School
Department
Course
Professor

Lecture 4 - Diagnostics and inference in regression
New concepts
✷Model diagnostics for simple linear regression models means to check the made
assumptions.
✷Q-Q plots with qqnorm.
✷Sampling distribution of least squares estimators is normal under assumptions
(A1)-(A4).
Applied Linear Models: Lecture 4 1
find more resources at oneclass.com
find more resources at oneclass.com

New topic – Model diagnostics
Theory – Assessing (A3), (A4) and linearity
1. Plot Yivs xito see if there is ≈a lin. relationship between Yand x.
2. If 1. seems reasonable estimate β0and β1and calculate residuals. To check the
normality assumption (A4) plot
(i) a boxplot of the residuals Rito check for symmetry and
(ii) a normal Q-Q plot, i.e. a plot of the ordered residuals vs Φ−1(i
n+1).
(iii) To check the homoscedasticity assumption (A3) plot Rivs xiand/or |Ri|
vs xi. There should be no obvious patterns, especially no curvatures such as
‘+β2x2
i’ or waves.
Draw some examples of pictures that show deviations for (iii), e.g. wedge, lying
woman, etc
Applied Linear Models: Lecture 4 2
find more resources at oneclass.com
find more resources at oneclass.com

Theory – Assessing (A1)
✷It is a property of the least squares method that
n
X
i=1
Ri= 0,so Ri= 0
and hence (A1) will always appear valid ‘overall’.
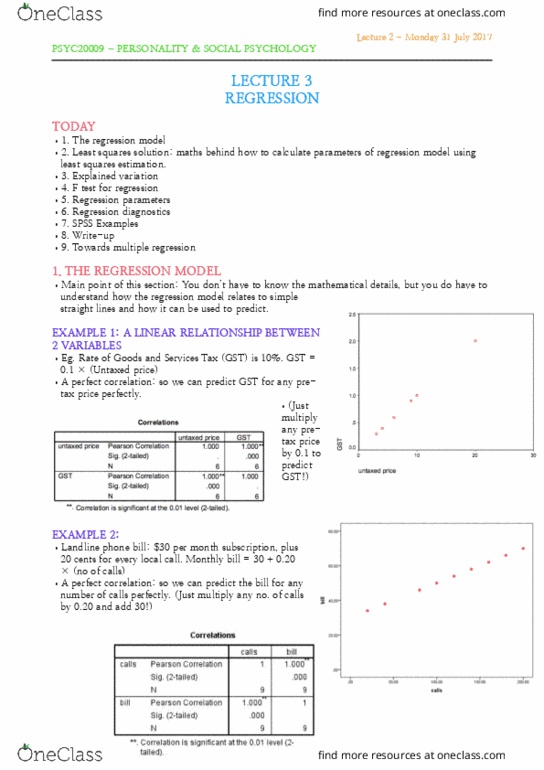
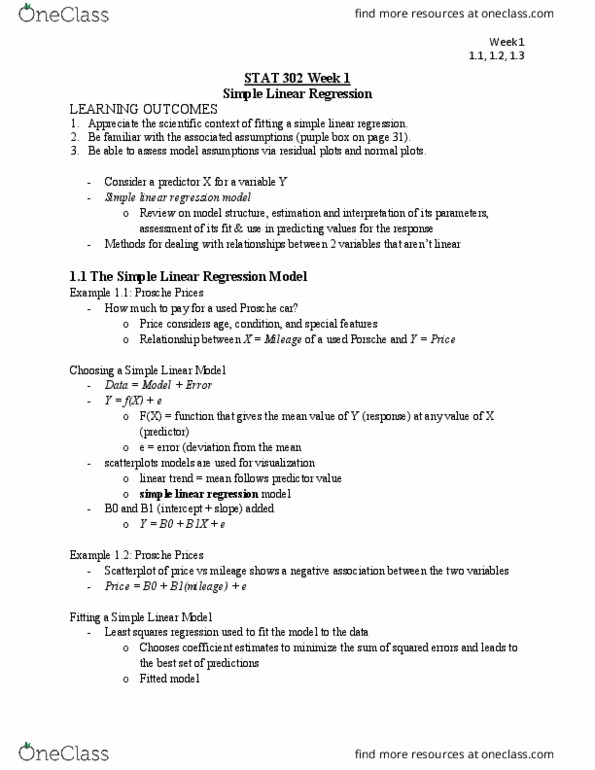
✷Trend in residual versus fitted values or covariate can indicate ‘local’ failure of
(A1). What do you conclude from the following plots from different simulations?
0.0 0.2 0.4 0.6 0.8
−0.5 0.0 0.5
Fitted values
Residuals
●
●
●
●
●
●
●
●
●
●
●
●
●
●
●
●
●
●
●
●
●
●
●
●
●
●
●
●
●
●
●
●
●
●
●
●
●
●
●
●
●
●
●
●
●
●
●
●
●
●
●
●
●
●
●
●
●
●
●
●
●
●
●
●
●
●
●
●
●
●
●
●
●
●
●
●
●
●
●
●
●
●
●
●
●
●
●
●
●
●
●
●
●
●
●
●
●
●
●
●
Residuals vs Fitted
50
30
15
0.05 0.06 0.07 0.08 0.09
−1.0 0.0 0.5 1.0
Fitted values
Residuals
●
●
●
●
●
●
●
●
●
●
●
●
●
●
●
●
●
●
●
●
●
●
●
●
●
●
●
●
●
●
●
●
●
●
●
●
●
●
●
●
●
●
●
●
●
●
●
●
●
●
●
●
●
●
●
●
●
●
●
●
●
●
●
●
●
●
●
●
●
●
●
●
●
●
●
●
●
●
●
●
●
●
●
●
●
●
●
●
●
●
●
●
●
●
●
●
●
●
●
●
Residuals vs Fitted
48
92
7
−0.6 −0.4 −0.2 0.0
−1.0 0.0 0.5 1.0
Fitted values
Residuals
●
●
●
●
●
●
●
●
●
●
●
●
●
●
●
●
●
●
●
●
●
●
●
●
●
●
●
●
●
●
●
●
●
●
●
●
●
●
●
●
●
●
●
●
●
●
●
●
●
●
●
●
●
●
●
●
●
●
●
●
●
●
●
●
●
●
●
●
●
●
●
●
●
●
●
●
●
●
●
●
●
●
●
●
●
●
●
●
●
●
●
●
●
●
●
●
●
●
●
●
Residuals vs Fitted
3
35
7
Applied Linear Models: Lecture 4 3
find more resources at oneclass.com
find more resources at oneclass.com
Document Summary
Lecture 4 - diagnostics and inference in regression. Model diagnostics for simple linear regression models means to check the made assumptions. Sampling distribution of least squares estimators is normal under assumptions (a1)-(a4). Theory assessing (a3), (a4) and linearity: plot yi vs xi to see if there is a lin. relationship between y and x, if 1. seems reasonable estimate 0 and 1 and calculate residuals. There should be no obvious patterns, especially no curvatures such as. Draw some examples of pictures that show deviations for (iii), e. g. wedge, lying woman, etc. It is a property of the least squares method that. Ri = 0, so ri = 0 nxi=1 and hence (a1) will always appear valid overall". Trend in residual versus tted values or covariate can indicate local" failure of (a1). Residuals vs fitted l s a u d s e. 50 l s a u d s e. 92 l s a u d s e.