ENVX1002 Lecture Notes - Lecture 16: Scatter Plot, Homoscedasticity

24 Jul 2018
School
Department
Course
Professor
Document Summary
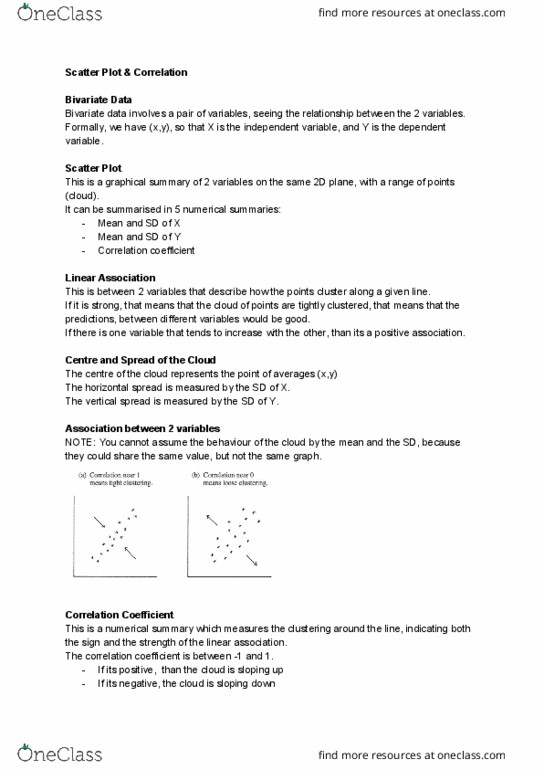
We are interested in the relationship between the 2 variables. Is a graphical summary of 2 variables on the same 2d plane, resulting in a cloud of points. The linear association between 2 variables measures how tightly the points cluster around a line. If there is a strong association, the cloud of points are tightly clustered around a line, and this allows for good predictions from 1 variable to another. The correlation coefficient measures the clustering around the line. It indicates both the sign and strength of the linear association. The correlation coefficient is between -1 and 1. Is r is positive : the cloud slopes up. If r is negative : cloud slopes down. As r gets closer to 1 the points cluster more tightly around the line. Is the mean of the product of the variables in standard units. The scatter plot is a cloud of points which represent bivariate data.