DATA1001 Lecture Notes - Lecture 10: Normal Distribution, Normality Test

20 Jul 2018
School
Department
Course
Professor
Document Summary
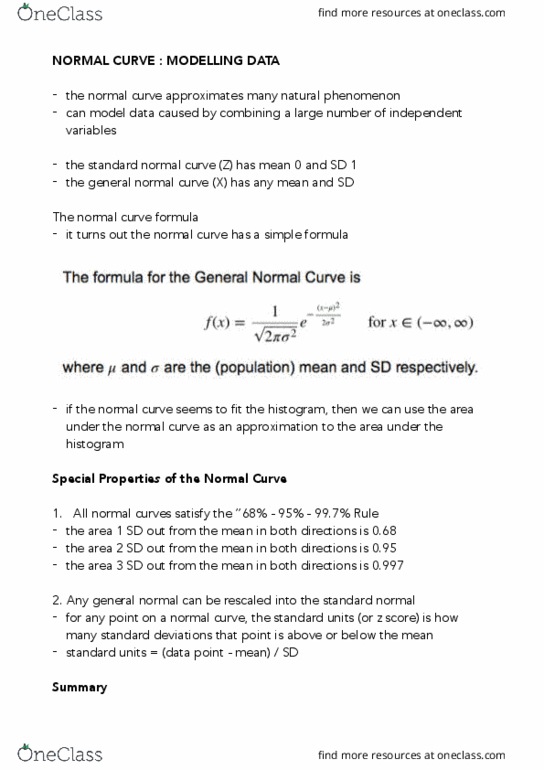
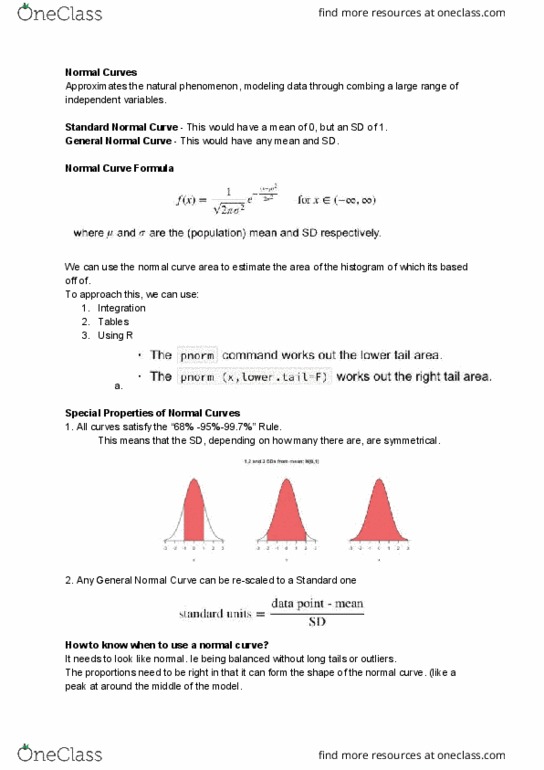
Data story: how likely is to find an elite netball goal player in. The normal curve: the normal curve was discovered around 1720 by abraham de moivre. The normal curve approximates many natural phenomemon: the normal curve can model data caused by combining a large number of independent variables. The standard normal curve (zz) has mean 0 and sd 1. The general normal curve (xx) has any mean and sd. If the normal curve seems to fit the histogram, then we can use the area under the normal curve as an approximation to the area under the histogram. Suppose we want to find out the area up to 0. 8: method1: integration. But this does not have a closed form: method2: normal tables (old school!, method3: use r, the pnorm command works out the lower tail area, the pnorm (x,lower. tail=f) works out the right tail area. Always sketch the normal curve and the relevant area and then use r!