BUSS1020 Lecture Notes - Lecture 3: Exploratory Data Analysis, Lincoln Near-Earth Asteroid Research, Skewness

27 Jul 2018
School
Department
Course
Professor
Document Summary
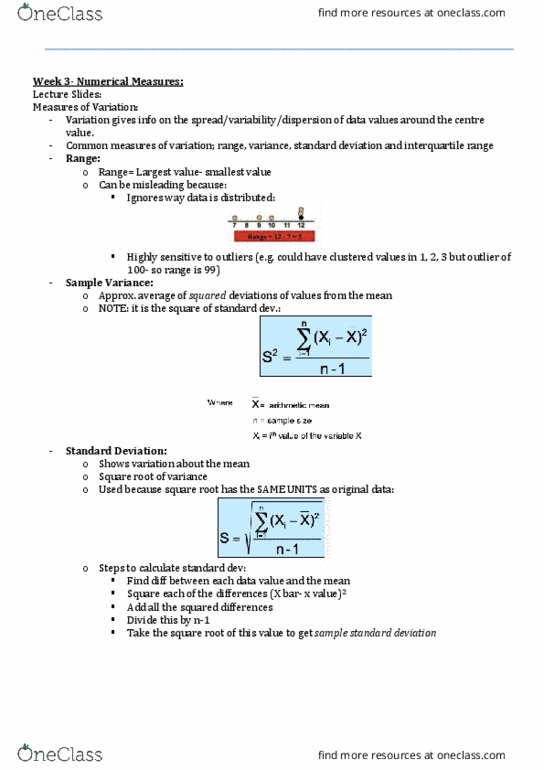
Variation is the amount of dispersion or scattering of values away from a central value that the values of a numerical variable show. Measures of variation include: range is the difference between the largest and smallest value = total spread. It takes the difference between each value and the mean squared, and then sum them (know as sum of squares (ss)), divided by sample size -1. This is used to compute the sample variance (s2). The sample standard deviation (s) is the square root of the sample variance and has same units as the original data. It measures the scatter in the data relative to the mean and hence is a relative measure of variation that is always a %: useful for comparing 2 or more sets of data that are in different units. Nb: it will always be a percentage: z score of a value is the difference between that value and the mean, divided by the standard deviation.