BUSS1020 Lecture Notes - Lecture 11: Confidence Interval, Box Plot, Homoscedasticity

5 Jun 2018
School
Department
Course
Professor

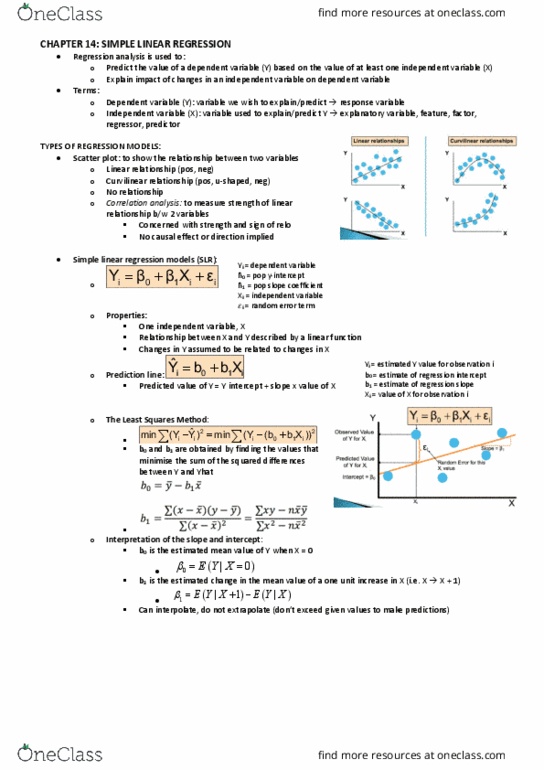
In exam b0 and b1 will be given to you (do not need to calculate those values yourself through hand
calculations/excel)
Regression analysis
1.
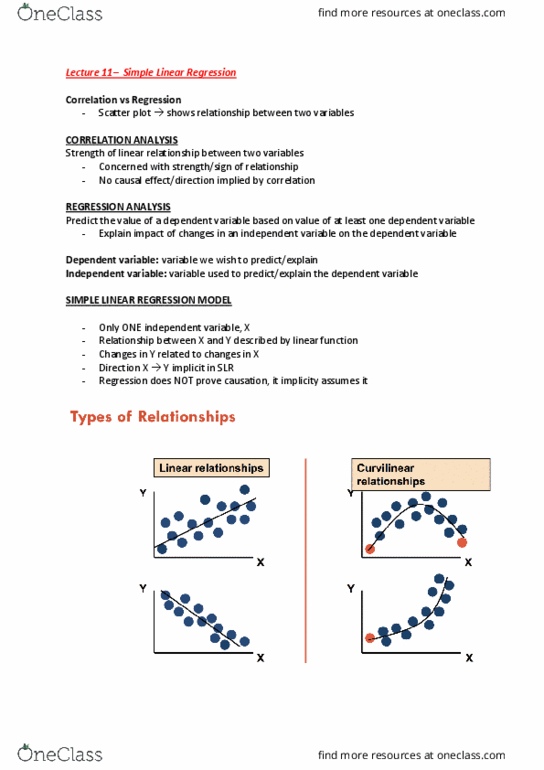
A scatter plot can be used to show the relationship between two variables
•
Correlation is only concerned with strength and sign of the relationship
○
No causal effect or direction is implied by correlation
○
Scatter plots were first presented in Ch. 2
○
Correlation was first presented in Ch. 3
○
Correlation analysis is used to measure the strength of the linear relationship between two
variables
•
Correlation vs Regression:
Predict the value of a dependent variable based on the value of at least one
independent variable
○
Explain the impact of changes in an independent variable on the dependent variable
○
Regression analysis is used to:
•
Dependent variable: the variable we wish to predict or explain
•
Independent variable: the variable used to predict or explain the dependent variable
•
Regression analysis:
Only one independent variable, X
•
Relationship between X and Y is described by a linear function
•
Changes in Y are assumed to be related to changes in X
•
The direction X --> Y is implicit in SLR
•
Regression does NOT prove causation, it implicitly assumes it
•
Simples linear regression (SLR) Model
11. Simple Linear Regression
Wednesday, 23 May 2018
11:06 AM
Textbooks Page 1

Textbooks Page 2

b0= intercept
-
b1= scope
-
Y hat = used for prediction
-
Textbooks Page 3
Document Summary
In exam b0 and b1 will be given to you (do not need to calculate those values yourself through hand calculations/excel) A scatter plot can be used to show the relationship between two variables. Correlation analysis is used to measure the strength of the linear relationship between two variables. Correlation is only concerned with strength and sign of the relationship. No causal effect or direction is implied by correlation. Predict the value of a dependent variable based on the value of at least one independent variable. Explain the impact of changes in an independent variable on the dependent variable. Dependent variable: the variable we wish to predict or explain. Independent variable: the variable used to predict or explain the dependent variable. Relationship between x and y is described by a linear function. Changes in y are assumed to be related to changes in x. The direction x --> y is implicit in slr.