ATHK1001 Lecture Notes - Lecture 14: Alcohol By Volume, Aspirin, Pearson Product-Moment Correlation Coefficient

9 Aug 2018
School
Department
Course
Professor
Document Summary
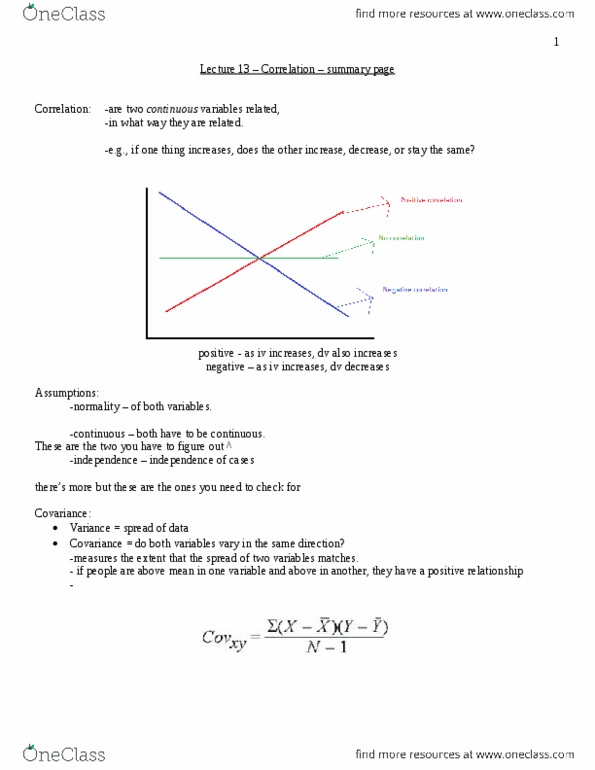
Correlation: correlation data: looking at the relationship between two variables that have been measured, running and training. 3 possibilities of relationships between the two variables (running and training): positively related (more training, better results, not related (despite training, running ability does not change, negatively related (more training worsens results) Just because, they correlate, doesn"t necessarily mean they"re causal. Correlation can only pick up linear relationships: e. g. no. of alcoholic drinks and blood alcohol level two variables are directly proportional. If we are interested in whether two variables are related, then ask whether change in one variable is met with similar change in another variable. E. g. they co-vary: if one changes, the other changes in a similar or systematic way: variance and covariance. Variance of single variables involves multiplying the deviations from the mean by themselves. Covariance of two variables involves multiplying one variable"s deviations by the others".