ATHK1001 Lecture Notes - Lecture 10: Central Limit Theorem, Stratified Sampling, Null Hypothesis

16 Jun 2018
School
Department
Course
Professor

Lecture - Cetral Liit Theore
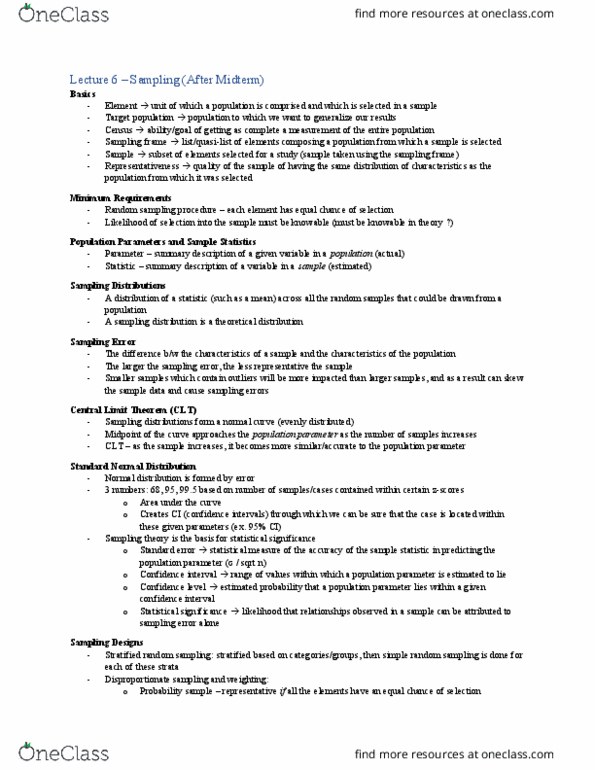
Stratified Sampling
• Not all groups within a population may have the same preferences e.g.
older people may favour one party more than young people do
- Pollster try to account for this by gathering a stratified sample, which is a
sample that has each subgroup contributing relative to its size
- Sometimes impossible to gather such sample, so to weight responses
differently later
CLT
• Form properly collected data samples, statistics gives us some
extraordinary power to generalize
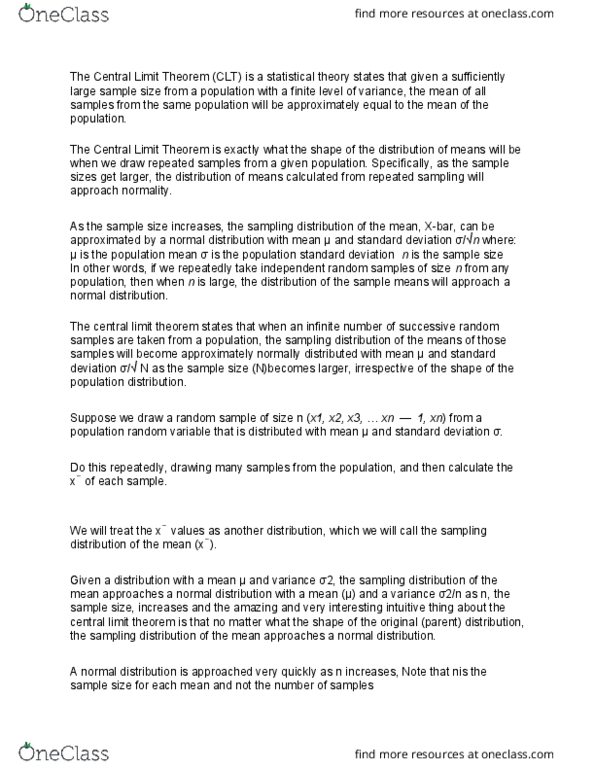
• CLT: given certain assumptions, that the means of samples drawn from a
population will be approximately normally distributed, regardless of the
data points, distribution
Sampling Distribution
• Sampling distribution is close to normal distribution
• CLT lets us estimate the sampling distributions from an observed sample
• Frequency distribution of sample means has normal distribution
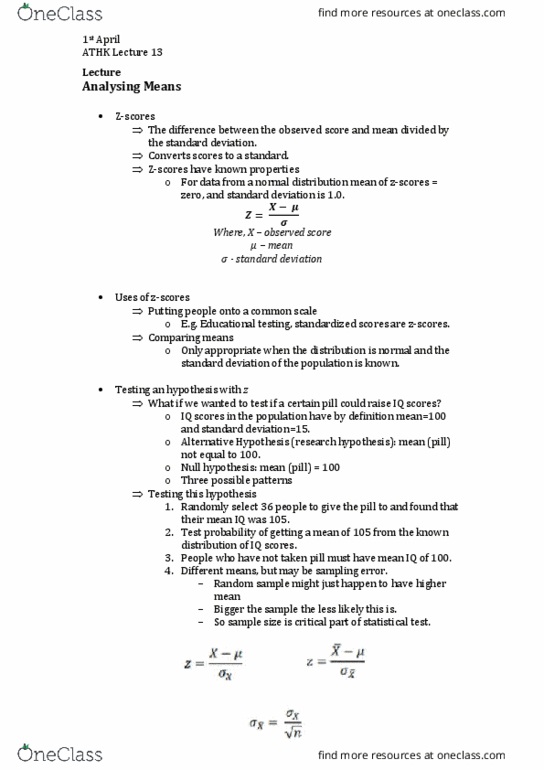
- Standard deviation of the sampling distribution is called the standard
error, and is equal to the standard deviation of a sample divided by the
square-root of the sample size
Using Probability
• Statistics cant prove anything with certainty
• Can only determine how likely something is
CLT
• Statistical inferences allows us to draw conclusions from large, properly
drawn samples
• CLT allows us to calculate how likely a given sample is to have come from
a given population
Hypothesis
• Is a proposed explanation for observed facts
• Science involves gathering observations, generating hypothesis to explain
them and then test the hypothesis to see if the predictions are true
• In statistics hypothesis testing is the procedure in which data from
samples are used to evaluate a hypothesis about a populating
Hypothesis Testing
• Any statistical inference starts with an implicit or explicit null hypothesis
(usually of no difference, so samples are from the same population)
• No change e.g. (the defendant is innocent) , we can try to reject it by
testing how likely the samples are from the same population distribution
find more resources at oneclass.com
find more resources at oneclass.com
Document Summary
Stratified sampling: not all groups within a population may have the same preferences e. g. older people may favour one party more than young people do. Pollster try to account for this by gathering a stratified sample, which is a sample that has each subgroup contributing relative to its size. Sometimes impossible to gather such sample, so to weight responses differently later. Clt: form properly collected data samples, statistics gives us some extraordinary power to generalize, clt: given certain assumptions, that the means of samples drawn from a population will be approximately normally distributed, regardless of the data points, distribution. Sampling distribution: sampling distribution is close to normal distribution, clt lets us estimate the sampling distributions from an observed sample, frequency distribution of sample means has normal distribution. Standard deviation of the sampling distribution is called the standard error, and is equal to the standard deviation of a sample divided by the square-root of the sample size.