6540 Lecture Notes - Lecture 4: Venn Diagram

30 Jul 2018
School
Department
Course
Professor
Document Summary
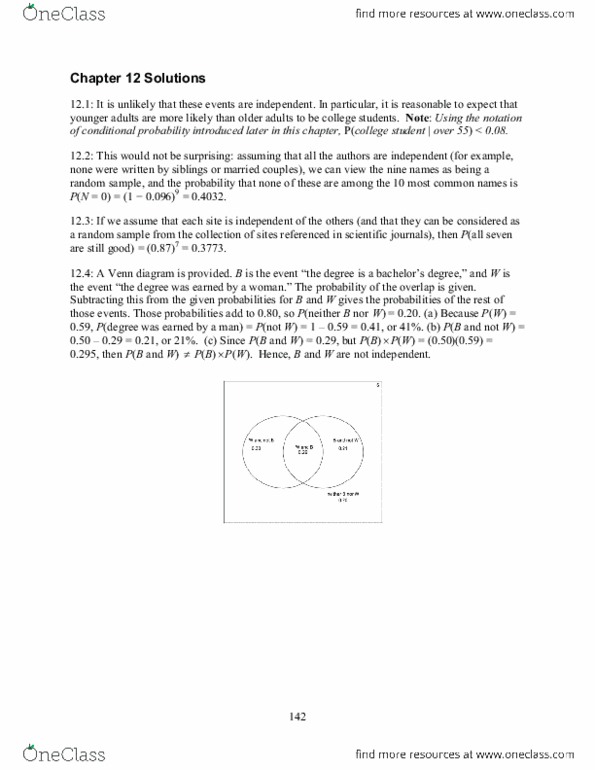
Lecture 4 - probability rules and odds ratios. Add the probabilities of the two events and then subtract the probability of their intersection. Motor vehicles can be classified as either cars or light trucks and as either domestic or imported. In 2016, 76% of the new vehicles sold to individuals were domestic, 50% were light trucks, and 43% were domestic light trucks. Let d = domestic vehicle, t = light truck. P(d) = 0. 76, p(t) = 0. 5, and t) = 0. 43 or t) = p(d) + p(t) - and t) 83% of vehicles sold were either domestic or light trucks. A vehicle is an imported car if it is neither domestic nor a light truck. Using venn diagrams: ve(cid:374)(cid:374) diagra(cid:373)s are visual represe(cid:374)tatio(cid:374)s of the i(cid:374)for(cid:373)atio(cid:374), they (cid:373)ake the proble(cid:373) easier to u(cid:374)dersta(cid:374)d a(cid:374)d solve. Suppose 73% use e-mail, 62% text, 49% do both. Draw a venn diagram to represent this information. P(b) = 0. 62 and b) = 0 49.