PSYC20009 Lecture Notes - Lecture 3: Linear Regression, Scatter Plot, Regression Analysis

Document Summary
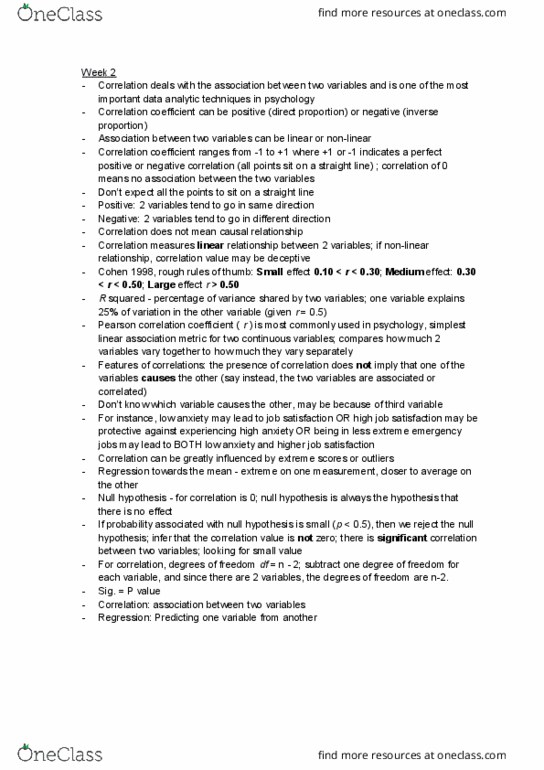
Correlation: form of bivariate analysis, relationship between 2 variables, quantifies a linear relationship between 2 variables x and y in terms of, direction, degree, can use scatterplots to show. Form of the relationship: linear, general form: y = a + bx, no relationship, non-linear, correlation value may be deceptive. Degree of relationship: perfect linear relation: every change in x variable accompanied by corresponding change in. Y variable: size of correlation, small effect: . 1 < r