STAT150 Lecture Notes - Lecture 4: Bar Chart, Random Variable, Box Plot

30 Aug 2018
School
Department
Course
Professor
Document Summary
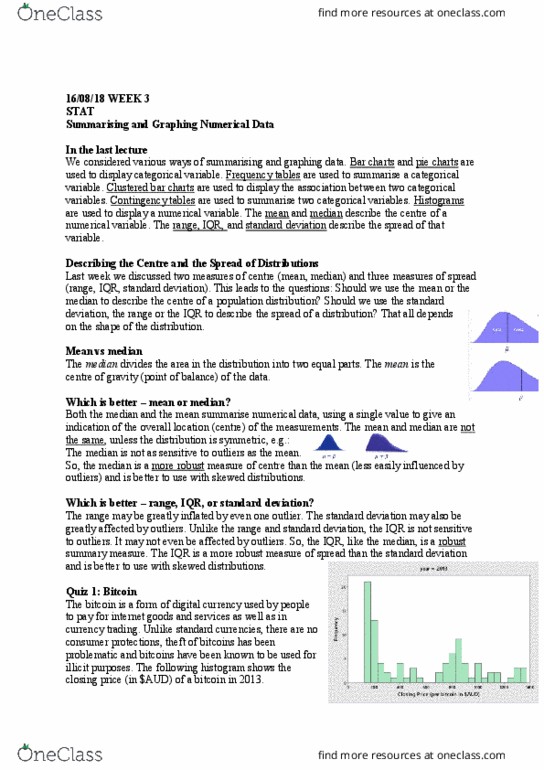
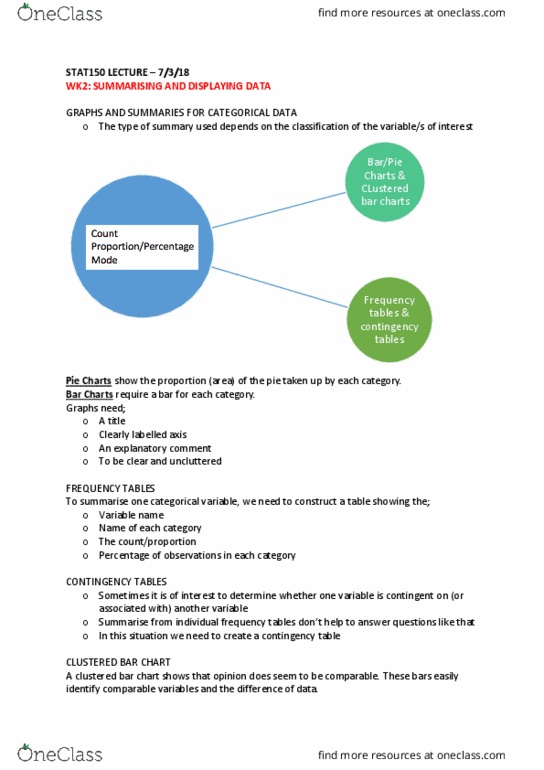
We looked at summarising and graphing numerical data. The most basic measures summarising numerical data are measures of centre and measures of spread. The mean and median are measures of centre. The range, standard deviation and iqr are measures of spread. We summarise categorical data by calculating the proportions of data in the categories of interest. We noted that histograms of large samples usually more closely resemble the population from which they are drawn than histograms of small samples. Bar chart: to identify the association between a student"s major and the final grade in. Scatterplot: compare exam marks for students majoring in accounting and students majoring in. The following output was obtained from a class test for 346 students. The class test was out of 200 marks: describe the shape of the distribution. In lecture 1 we looked at some variables.