STAT150 Lecture Notes - Lecture 4: Standard Deviation

29 Jun 2018
School
Department
Course
Professor

STAT150 LECTURE – 21/3/18
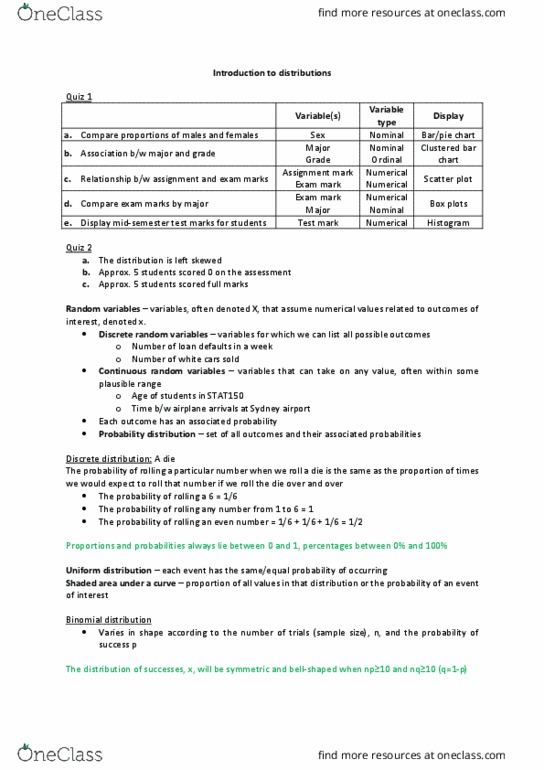
WK4: INTRODUCTION TO DISTRIBUTIONS
CONTINUOUS DISTRIBUTION
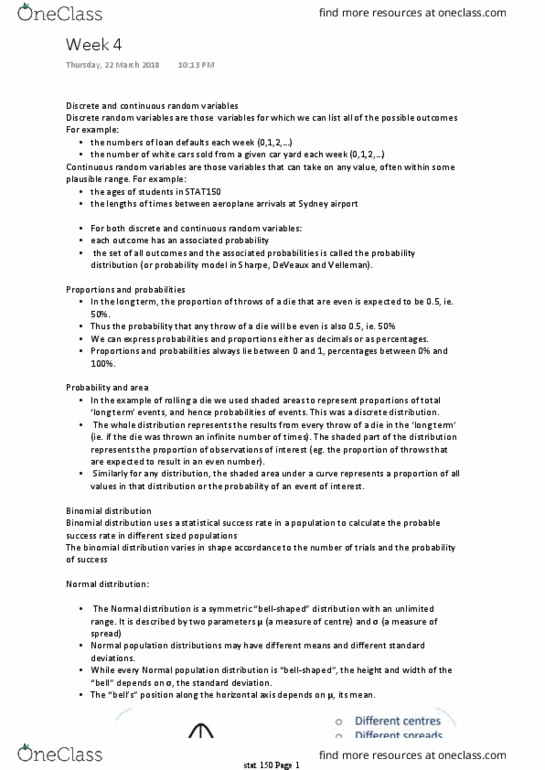
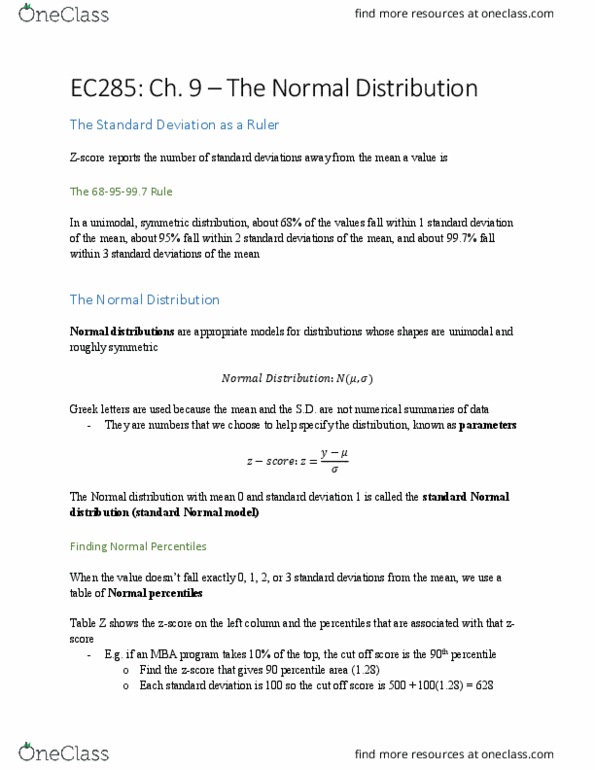
-The Normal Distribution; the normal distribution is a symmetric ‘bell-shaped’
distribution with an unlimited range. It is described by two parameters - (a
measure of centre) and (a measure of spread).
AREAS UNDER A NORMAL CURVE
Middle Point; mean/average
Values Left and Right; standard deviation increments
- We can convert any normal distribution into a standard normal (z) distribution by
standardising, i.e. we take a value, y, we subtract the mean, , and we divide the
result by the standard deviation, ;
Z-SCORES AND PROBABILITY
We see that increasingly larger shaded areas of the normal distribution represent
increasingly large proportions of the population.
The Normal Distribution:
In Excel: =NORMDIST(0,0,1,TRUE)
CALCULATING A Y-VALUE
PERCENTILES
The pth percentile is the value such that p% of the values in the distribution are lower than it.
find more resources at oneclass.com
find more resources at oneclass.com
Document Summary
The normal distribution; the normal distribution is a symmetric bell-shaped" distribution with an unlimited range. It is described by two parameters - (a measure of centre) and (a measure of spread). We can convert any normal distribution into a standard normal (z) distribution by standardising, i. e. we take a value, y, we subtract the mean, , and we divide the result by the standard deviation, ; We see that increasingly larger shaded areas of the normal distribution represent increasingly large proportions of the population.