PSYC105 Lecture 4: Statistic Lecture Week 4 - Summarising Data

11 Oct 2018
School
Department
Course
Professor
Document Summary
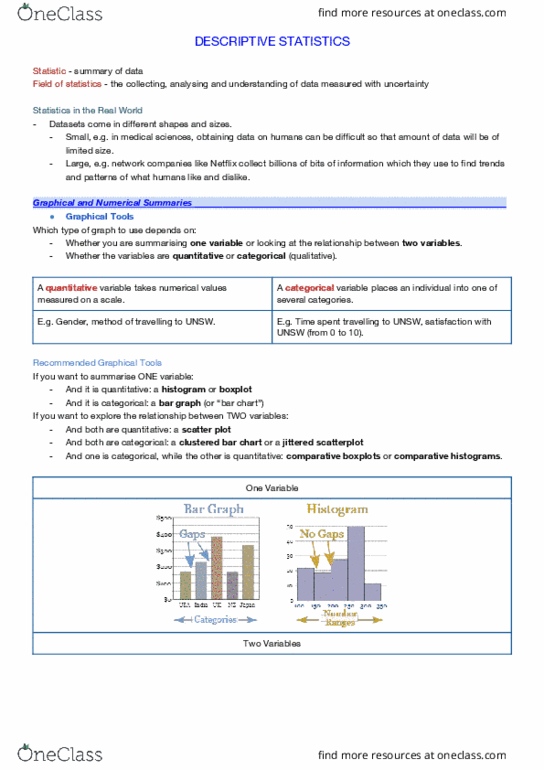
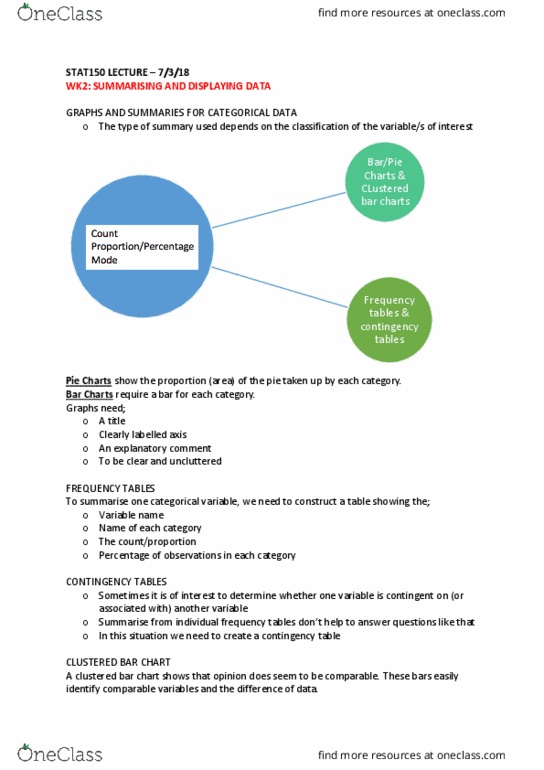
Presenting data: once data is collected, researchers need to think of how to present the data, data can be presented in 2 formats, listed useful for small amounts of data; not so much for many observations, summarised. Summarising data: to communicate our findings, and prepare for data analysis, we need to summarise data, univariate vs. bivariate summaries, two types of summary displays: Graphical summary: appropriate summary depends on the kind of data: what is the measurement type of the variable, categorical (qualitative) data: discrete categories or groups. Frequency tables and bar chart/ pie chart: numeric (quantitative) data: a score on a scale. Numeric summary statistics (mean/median/mode, standard deviation) and a histogram: think about. Categorical data: frequency table: list of categories and the count (frequency) of how many participants fall into them, bar chart: x (horizontal) axis is distinct categories, y (vertical) axis is count or %