PSY248 Lecture Notes - Lecture 11: Rank 1, Odds Ratio, Type I And Type Ii Errors

2 Jun 2018
School
Department
Course
Professor

Non-Parametric Tests: Week 11-12
Non-parametric tests → we use these when our normal distribution does not adhere to
our assumptions of normality
Background:
• There are a lot of statistical tests in existence
• Important to learn what is appropriate to use, when
• This depends on your RQ
o 1. What are you investigating?
o 2. How was the data collected?
o 3. What are your variables like?
o 4. What do you want to compare/associate (what is the effect of
interest)?
Assumptions
• All statistical tests have assumptions
• Assumptions for ANOVA
o Normal distribution of the DV (within groups)
o Equality of variance of DV across groups
o Independence of data points
• Why is it important for these to be met?
• The importance of assumptions relates to our desire to make inferences
o Don’t need any statistical analysis to see if e.g. males and females
perform differently at university: look at 2 means and see if they vary
o If I generalize that sample difference to a wider population, though, I
am making an inference
• Accuracy of the p-values for inferences are based on assumptions – if we
violate this assumption, then the accuracy of p-values is reduced
• Sample size is important
Violations of assumptions
• If violated – what do we do?
1. Accept robustness of the test
2. Change the data to fit the test
3. Change the test to fit the data
• Non-parametric tests are an example of #3
Example: drug use and depression
• RQ – is there a difference in experiences of depression in people who use
different recreational drugs?
• Drug – alcohol vs. ecstasy
• Depression (BDI) measured 1 day after drug use (Sunday)
• Single-factor between-groups design
• 2 (separate) groups → independent-samples t-test
Assessing normality
• To assess normality of a distribution, we can:
find more resources at oneclass.com
find more resources at oneclass.com

o 1. Look at a histogram
o 2. Look at numeric summaries
o 3. Perform a statistical test: tests the significance of the difference
between any distribution and a normal distribution
• ideally, use all 3 to make an informed decision about whether a distribution is
normal (each has their strengths and limitations)
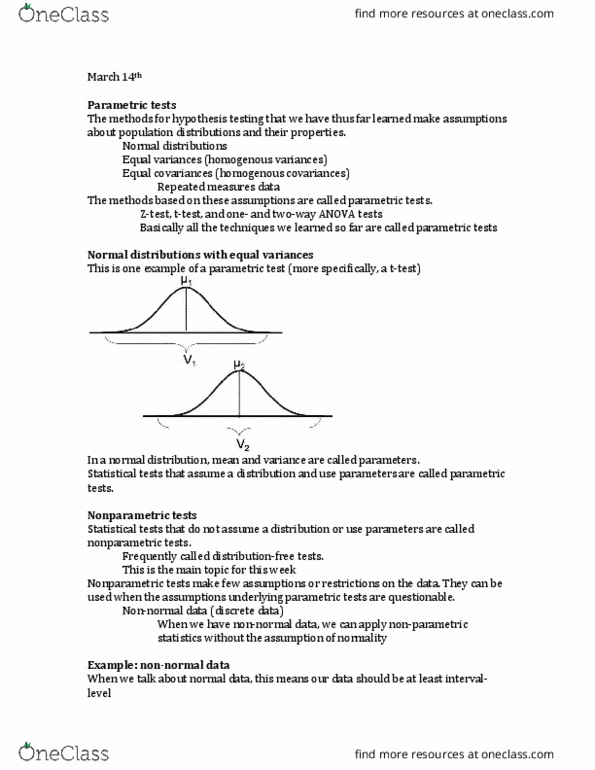
Normality
• 5 features of a normal distribution
o 1. Central tendency
o 2. Unimodal
o 3. Symmetrical (lack of skew)
o 4. Mesokurtic
o 5. Variability
• SPSS syntax
o Examine /variables=Sunday by drug/plot npplot histogram
• Histograms, numeric statistics will appear
• Shapiro-Wilk test of normality
o You want them to be non-significant so there is no difference
o The higher your sample size is, the more likely Shapiro-Wilk test is to
be significant
o Although from the central limit theorem, it suggests that the higher
your sample size, the more likely it is to fit a normal distribution
• T-test results
o T-test/groups=drugs(1 2)/ variables=Sunday
Example: drug use and depression
• Can we trust the t-test results?
• Should do something different, so that we can have more faith in our findings
• Ideally, choose a different analysis
A different approach
• Distributional assumptions apply to the raw data itself
• Non-parametric tests all rank the data and perform analyses on the ranks
• Solves distributional problems and gets rid of any unusual values (outliers)
Rank
• Say we sampled the age of 5 people in this class
• Our data would be 18, 19, 20, 21, 22
• To turn that into a set of ranks is easy → 1, 2, 3, 4, 5
• Take our scores and order them from lowest to highest
• Lose all information on degree of difference
o Difference between 18 and 19 is made equivalent to the difference
between 21 and 35
• This is why it is beneficial for skewed distributions and those with outliers
Tied ranks
• Say we had some people with the same age (19)
find more resources at oneclass.com
find more resources at oneclass.com

• We’d have to give them equal ranks, which is the average of what their ranks
would have been, had they not been equal
• E.g. with a data set of 18, 19, 19, 20, 21, 22
• Rank → 1, 2.5, 2.5, 4, 5, 6
Ranking:
• This is the underlying principle to non-parametric tests
o Analyses are performed on ranks, not raw data
o How this is done varies a bit from test to test (and also depends on the
study design) but the principle is the same
Non-parametric tests
• Aka assumption-free tests (because they make fewer assumptions, not none)
• Generally, answer the same kinds of questions we’re interested in in
experimental designs
o Is there a difference in scores between 3 treatment groups?
o Does performance change over time?
Part 1: two independent groups (non-parametric equivalent to independent samples t-
test)
Drug use and depression
• Looking at whether depression scores vary between those who drank alcohol
and those who took ecstasy
o Parametric test: independent samples t-test
o Non-parametric equivalent: Mann-Whitney test
• Mann Whitney test
o First, we sort our data according to depression scores (lowest to
highest)
• Then we rank our scores
o Person with the lowest score (13) gets a 1
o Person with highest score (35) gets a 20
o Remember how to deal with tied ranks
• Once all the scores are ranked, add up the ranks for each group separately
o Sum ranks for alcohol group
o Sum ranks for ecstasy group
• If there was no difference in depression scores between the two groups, we’d
expect the summed ranks to be pretty much equal
o Sum of ranks – ecstasy = 119.5
o Sum of ranks – alcohol = 90.5
o Ecstasy is higher than alcohol – is it higher enough to trump sampling
variability?
• We’re in need of a test statistic, so we can see how likely it is that we would
find this difference in rank sums, if no difference existed in the population (i.e.
a p value to tell us to reject or not reject null hypothesis)
Null hypothesis
• Independent samples t-test
o Null hypothesis → populations have the same mean
find more resources at oneclass.com
find more resources at oneclass.com
Document Summary
Non-parametric tests we use these when our normal distribution does not adhere to our assumptions of normality. Background: there are a lot of statistical tests in existence, this depends on your rq. Important to learn what is appropriate to use, when: 1. If violated what do we do: accept robustness of the test, change the data to fit the test, change the test to fit the data, non-parametric tests are an example of #3. Assessing normality: to assess normality of a distribution, we can, 1. Perform a statistical test: tests the significance of the difference between any distribution and a normal distribution ideally, use all 3 to make an informed decision about whether a distribution is normal (each has their strengths and limitations) Normality: 5 features of a normal distribution, 1. Example: drug use and depression: can we trust the t-test results, should do something different, so that we can have more faith in our findings.