STAT1008 Lecture Notes - Lecture 25: Central Limit Theorem, Null Hypothesis, Standard Deviation


STAT1008 Week 9 Lecture A
● Tongue Curling:
○ Null hypothesis proportion = 0.75
○ How do we test this hypothesis?
■ Calculate SE = sqrt(0.5(1-0.5)/50)
■ Z~N(0,1) where z = p hat - p0 /SE
● Hypothesis testing
○ For hypothesis testing, we want the distribution of the sample proportion
assuming the null hypothesis is true
■ Ho: p = p0 = 0.75
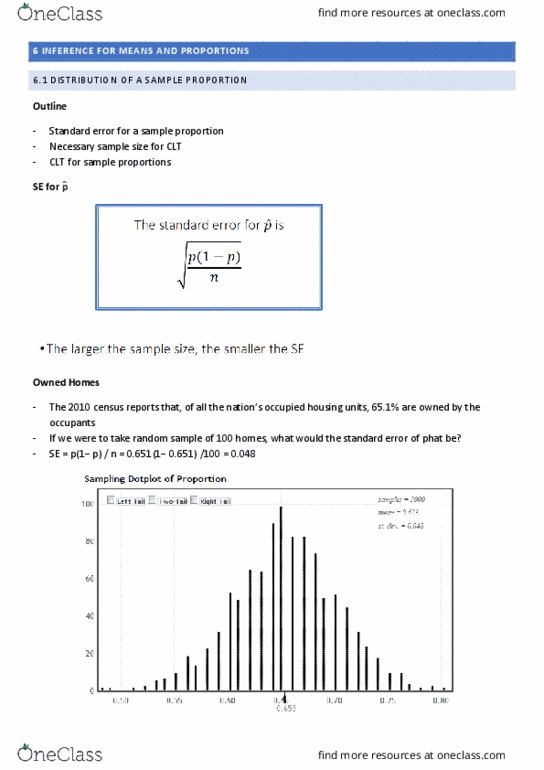
■ SE = sqrt(p(1-p)/n)
■ Use the null value under the null hypothesis thus SE = sqrt(p0(1-p0)/n)
■ From CLT (central limit theorem) p~N(p0,SE)
■ Test statistic: z= p-p0/sqrt(p0(1-p0)/n)~N(0,1)
■ If np0 > or equal to 10 and n(1-po) > or equal to 10, then the p-value can
be computed as the area in the tail(s) of a standard normal beyond z
○ E.g. Baseball Home Field Advantage
■ Of the 2430 Major League Baseball (MLB) games played in 2009, the
home team won in 54.9% of the games
■ If we consider 2009 as a representative sample of all MLB games, is this
evidence of a home field advantage in Major League Baseball?
■ Counts are greater than 10 in each category
■ H0 : p = 0.5
■ Ha: p > 0.5
■ Z = p hat - p0/(sqrt(p0(1-p0)/n) = 0.549-0.5/sqrt(0.5(1-0.5)/2430) = 4.86
■ Z~N(0,1) => P(Z > or equal to 4.86)
■ P - value = 6.2x10⁻⁷ thus based on this data, there is strong evidence of a
home field advantage in major league baseball
● Standard error for mean:
○ SE = sigma/sqrt(n) where sigma = population standard deviation
○ The larger the sample size, the smaller the SE
○ E.g. Olympic Marathon Times
■ 78 runners finished the 2008 Olympic Men’s Marathon. The averaging
finishing time was mu = 141 minutes, and the standard deviation of
finishing times was sigma = 7.4 minutes
■ If we were to take random samples of 10 men finishing the 2008 Olympic
marathon, what would the standard error of mean be?
● SE = sigma/sqrt(n) = 7.4/sqrt(10) = 2.3 minutes
■ SE only depends on the population standard deviation and the size of the
population. Thus doesn’t matter about individual times and jazz only size
● CLT for a mean:
find more resources at oneclass.com
find more resources at oneclass.com
Document Summary
Z~n(0,1) where z = p hat - p0 /se. For hypothesis testing, we want the distribution of the sample proportion assuming the null hypothesis is true. Use the null value under the null hypothesis thus se = sqrt(p0(1-p0)/n) If np0 > or equal to 10 and n(1-po) > or equal to 10, then the p-value can be computed as the area in the tail(s) of a standard normal beyond z. Of the 2430 major league baseball (mlb) games played in 2009, the home team won in 54. 9% of the games. Counts are greater than 10 in each category. Z = p hat - p0/(sqrt(p0(1-p0)/n) = 0. 549-0. 5/sqrt(0. 5(1-0. 5)/2430) = 4. 86. Z~n(0,1) => p(z > or equal to 4. 86) P - value = 6. 2x10⁻⁷ thus based on this data, there is strong evidence of a home field advantage in major league baseball. Se = sigma/sqrt(n) where sigma = population standard deviation. The larger the sample size, the smaller the se.