STAT 2500 Lecture Notes - Lecture 3: Pie Chart, Bar Chart, Standard Deviation

17 Dec 2018
School
Department
Course
Professor
Document Summary
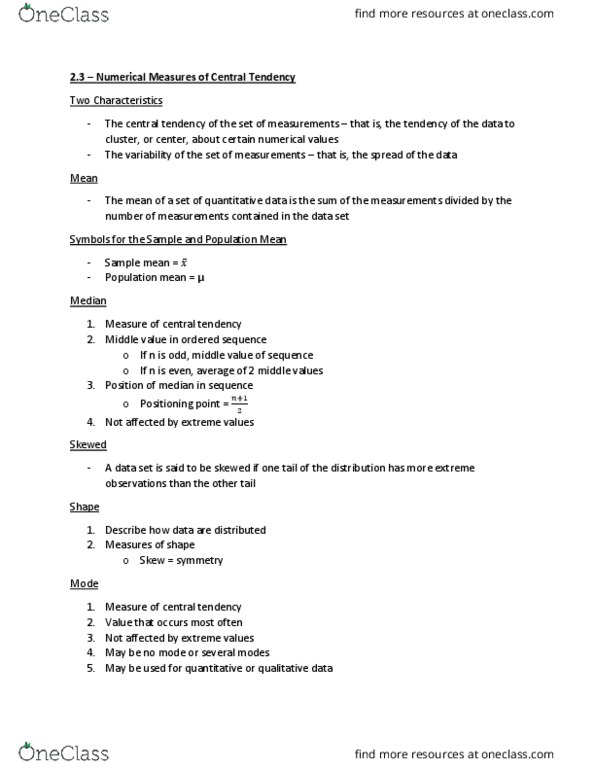
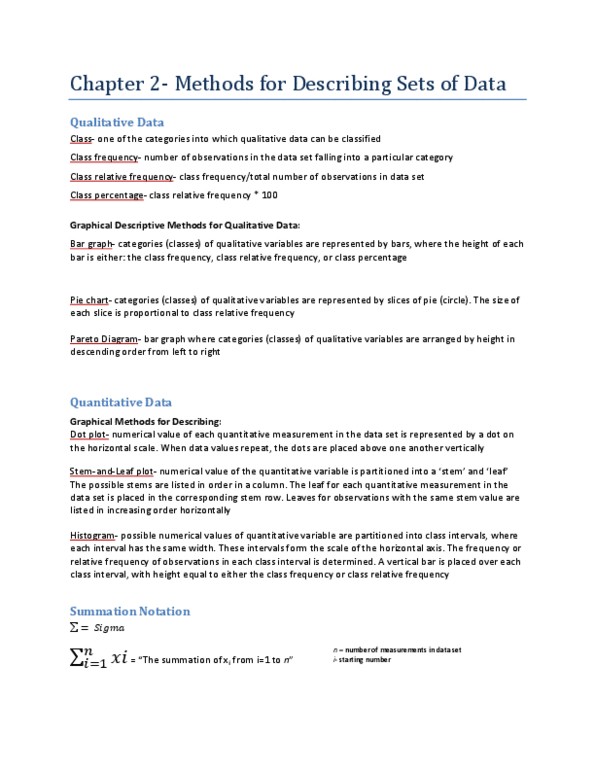
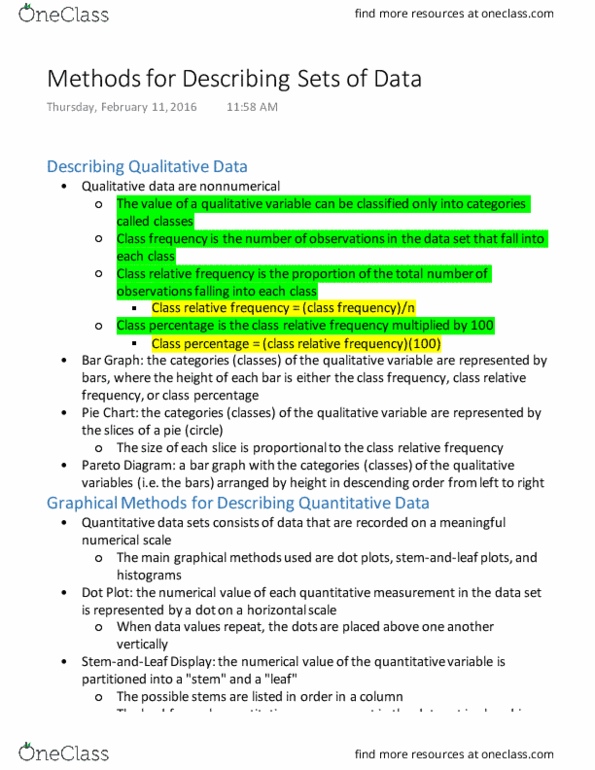
Chapter 2: methods for describing sets of data. Contents: describe qualitative data, graphical methods for describing quantitative data, numerical measures of central tendency, numerical measures of variability, using the mean and standard deviation to describe data, numerical measures of relative standing. Learning objectives: describe data using graphs, describe data using numerical measures, describe quantitative data using numerical measures. Class: one of the categories into which qualitative data can be classified. Is the number of observations in the data set falling into a particular class. Class relative frequency: the class frequency divided by the total numbers of observations in the data set. Class percentage: the class relative frequency multiplied by 100. Summary table: lists categories and number of elements in category, obtained by tallying responses in category, may show frequencies (counts), % or both. Pie chart: shows breakdown of total quantity into categories, useful for showing relative differences, angle size.